Analysis 3 min read
Clean a sensor series, then plot it
Chain data-clean and results-summary, fill two specified gaps through the Pandas MCP, and plot the checked output.
- Written for
- CLIO Kit 2.11
- Works in
- Claude Code · Codex · Clio Coder · OpenCode
- Basis
- Recorded sessions · 7 Oct 2026
Use two skills in sequence: data-clean for a specific repair, then results-summary for the handoff to Plot. The agent works through the real Pandas and Plot MCPs. The screenshots are real sessions in Claude Code, Codex, Clio Coder and OpenCode, recorded with the versions listed in Explore an HDF5 file.
1. Supply a bounded repair
With the launcher installed, make a new
project. Download sensor.csv, or save this as sensor.csv:
time_s,signal_mV
0,1
1,
2,3
3,
4,5
The samples are one second apart. For this demonstration we explicitly choose linear interpolation for the two interior gaps. That choice is part of the task; missing data alone does not justify a particular imputation method.
2. Install two MCPs and two skills, then ask
Each client keeps project MCP servers in its own file. The two skills are the same portable folders in every client.
- Claude Code
- Codex
- Clio Coder
- OpenCode
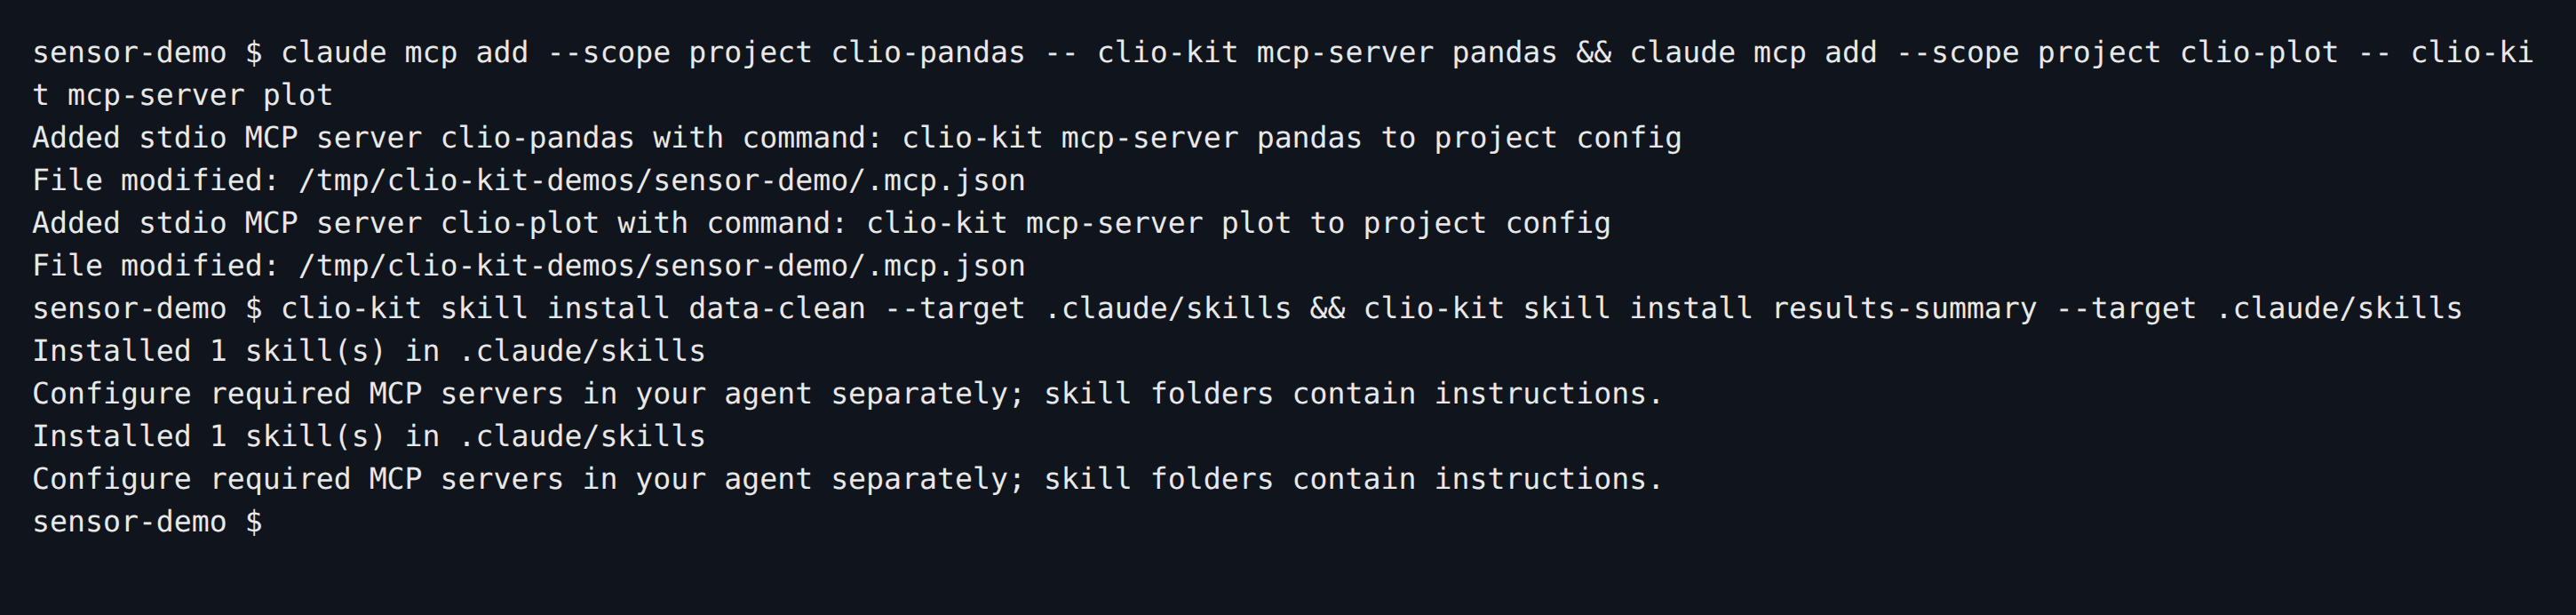
claude mcp add --scope project clio-pandas -- clio-kit mcp-server pandas
claude mcp add --scope project clio-plot -- clio-kit mcp-server plot
clio-kit skill install data-clean --target .claude/skills
clio-kit skill install results-summary --target .claude/skills
claude
Enable the two project MCP servers, then paste:
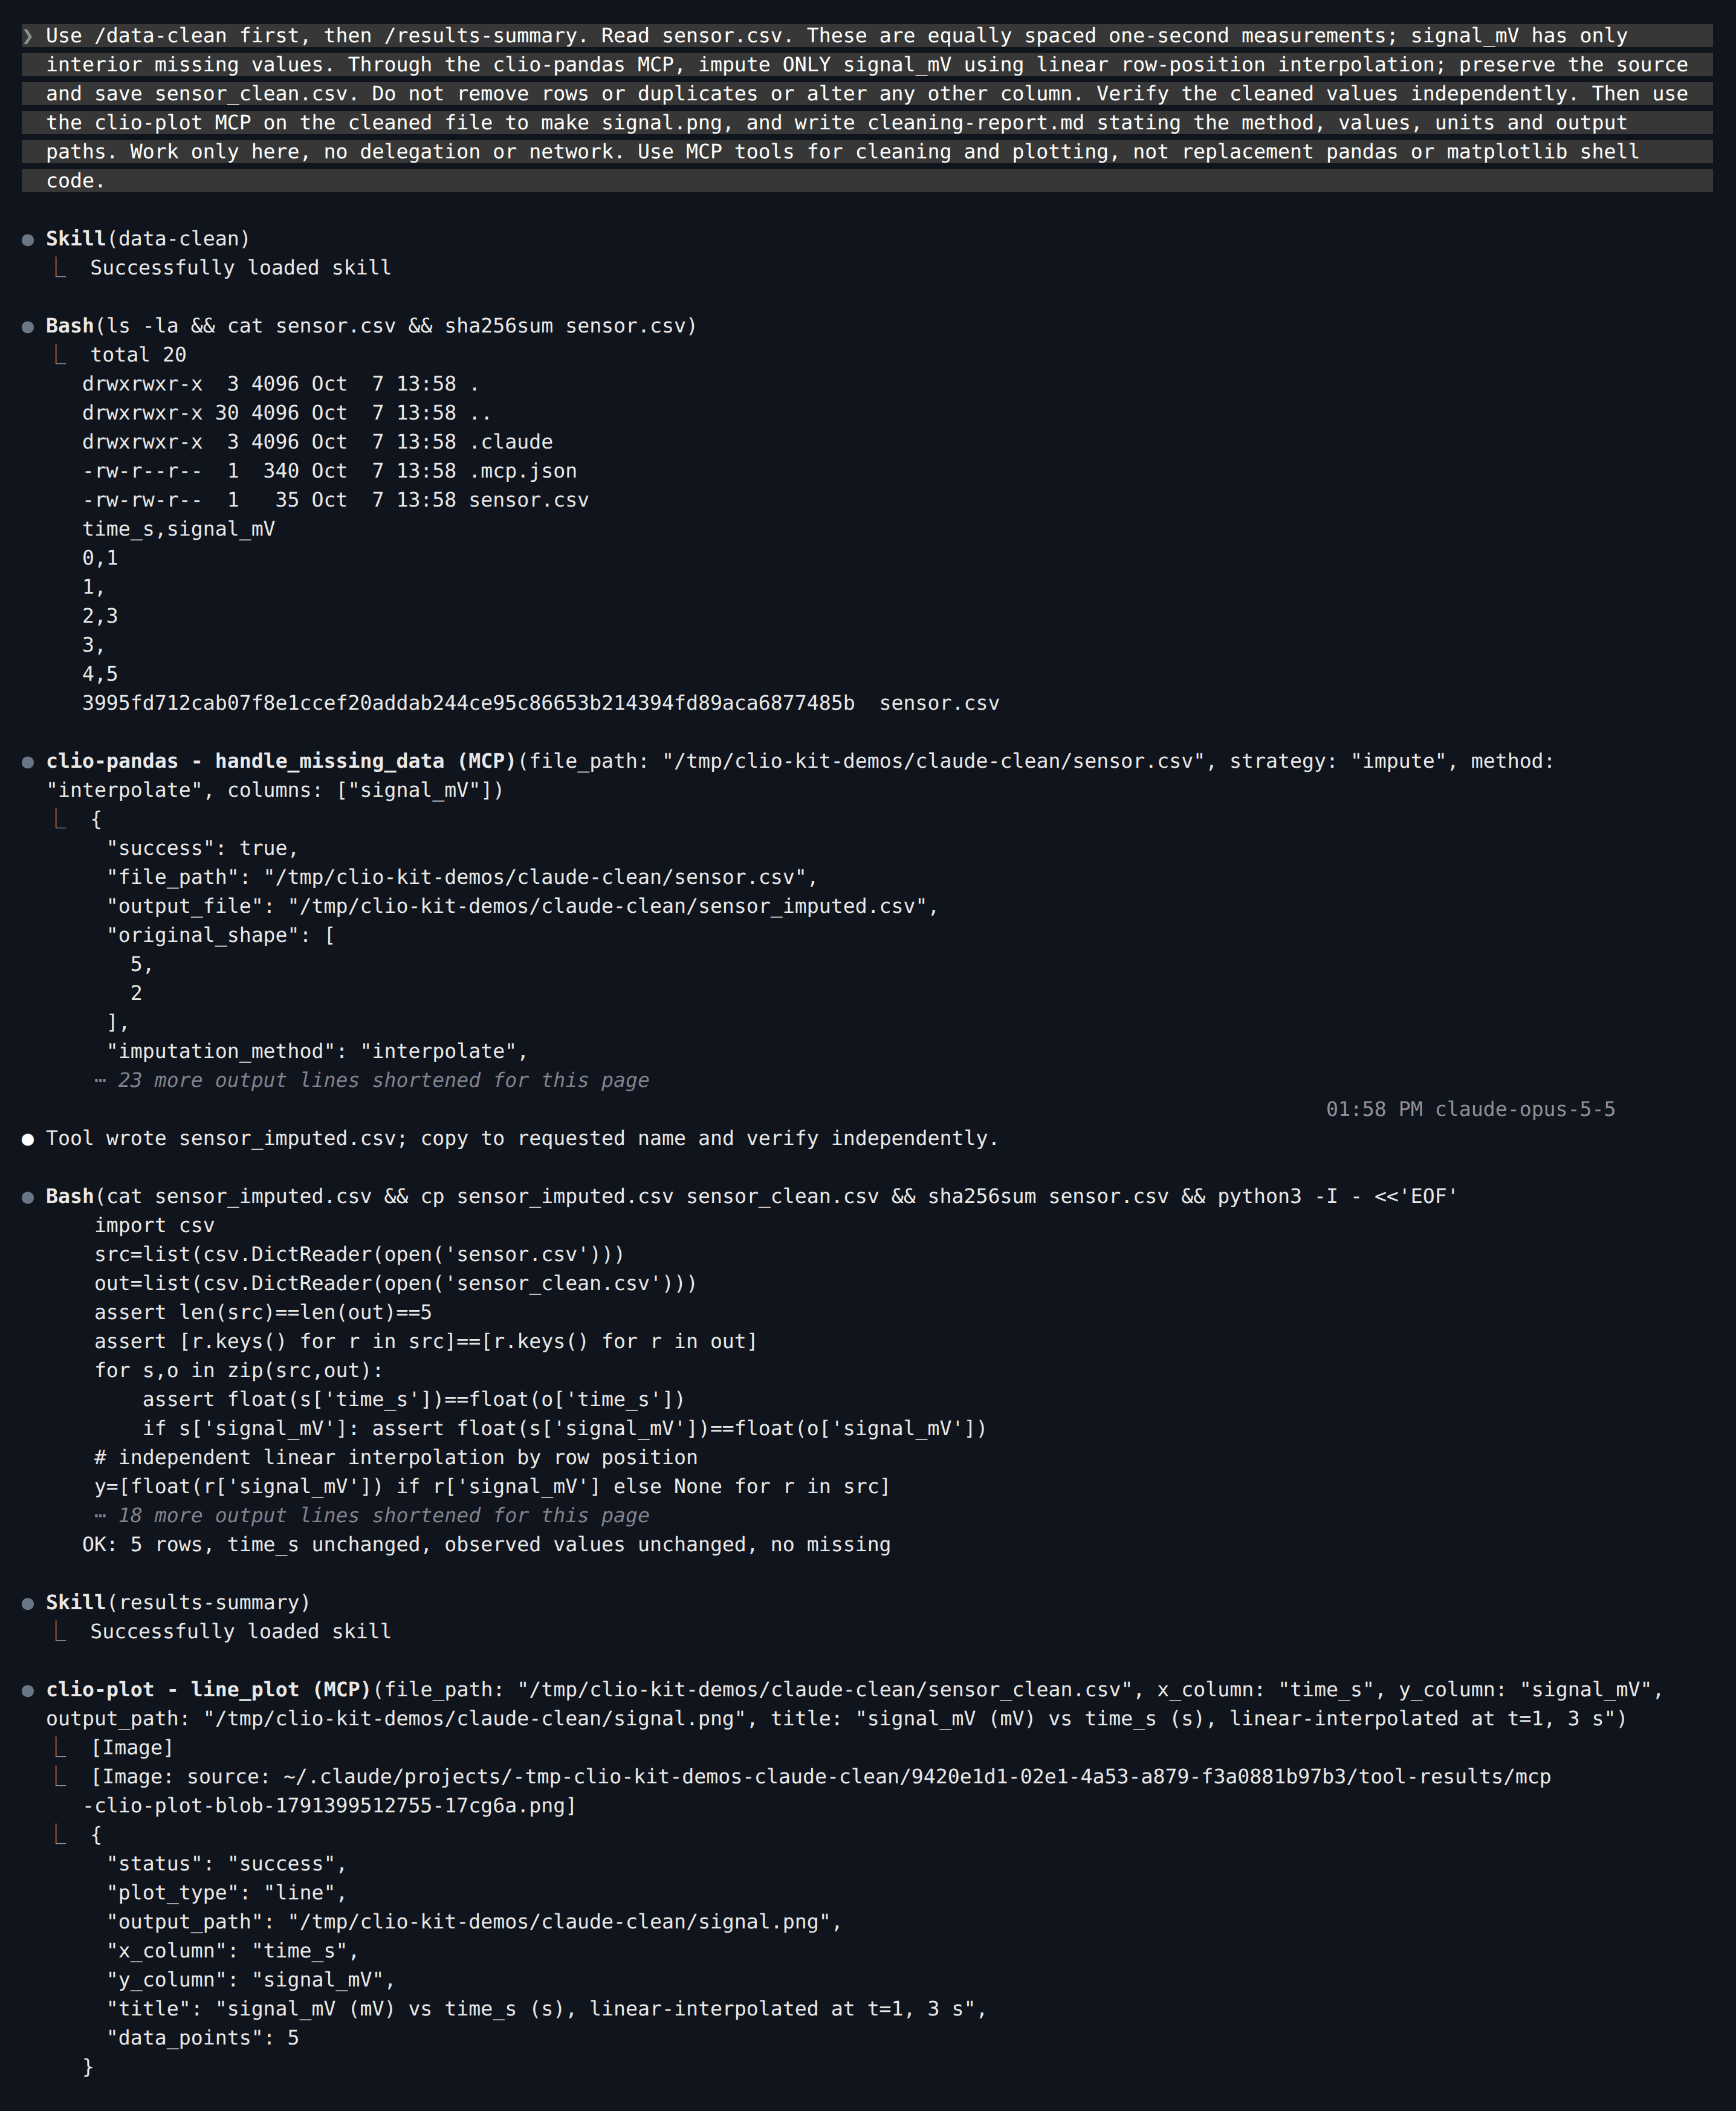
Use /data-clean first, then /results-summary. Read sensor.csv. These are equally spaced one-second measurements; signal_mV has only interior missing values. Through the clio-pandas MCP, impute ONLY signal_mV using linear row-position interpolation; preserve the source and save sensor_clean.csv. Do not remove rows or duplicates or alter any other column. Verify the cleaned values independently. Then use the clio-plot MCP on the cleaned file to make signal.png, and write cleaning-report.md stating the method, values, units and output paths. Work only here, no delegation or network. Use MCP tools for cleaning and plotting, not replacement pandas or matplotlib shell code.
Save this as .codex/config.toml in the project, which Codex reads once you
trust the folder:
[mcp_servers.clio-pandas]
command = "clio-kit"
args = ["mcp-server", "pandas"]
startup_timeout_sec = 120

[mcp_servers.clio-plot]
command = "clio-kit"
args = ["mcp-server", "plot"]
startup_timeout_sec = 120
clio-kit skill install data-clean --target .agents/skills
clio-kit skill install results-summary --target .agents/skills
codex
Paste:
Use $data-clean first, then $results-summary. Read sensor.csv. These are equally spaced one-second measurements; signal_mV has only interior missing values. Through the clio-pandas MCP, impute ONLY signal_mV using linear row-position interpolation; preserve the source and save sensor_clean.csv. Do not remove rows or duplicates or alter any other column. Verify the cleaned values independently. Then use the clio-plot MCP on the cleaned file to make signal.png, and write cleaning-report.md stating the method, values, units and output paths. Work only here, no delegation or network. Use MCP tools for cleaning and plotting, not replacement pandas or matplotlib shell code.

Save this as .clio-coder/mcp.yaml:
version: 1
servers:
  - id: clio-pandas
    command: clio-kit
    args: [mcp-server, pandas]
    timeoutMs: 120000
  - id: clio-plot
    command: clio-kit
    args: [mcp-server, plot]
    timeoutMs: 120000
clio-coder mcp trust clio-pandas
clio-coder mcp trust clio-plot
clio-kit skill install data-clean --target .clio-coder/skills
clio-kit skill install results-summary --target .clio-coder/skills
clio-coder
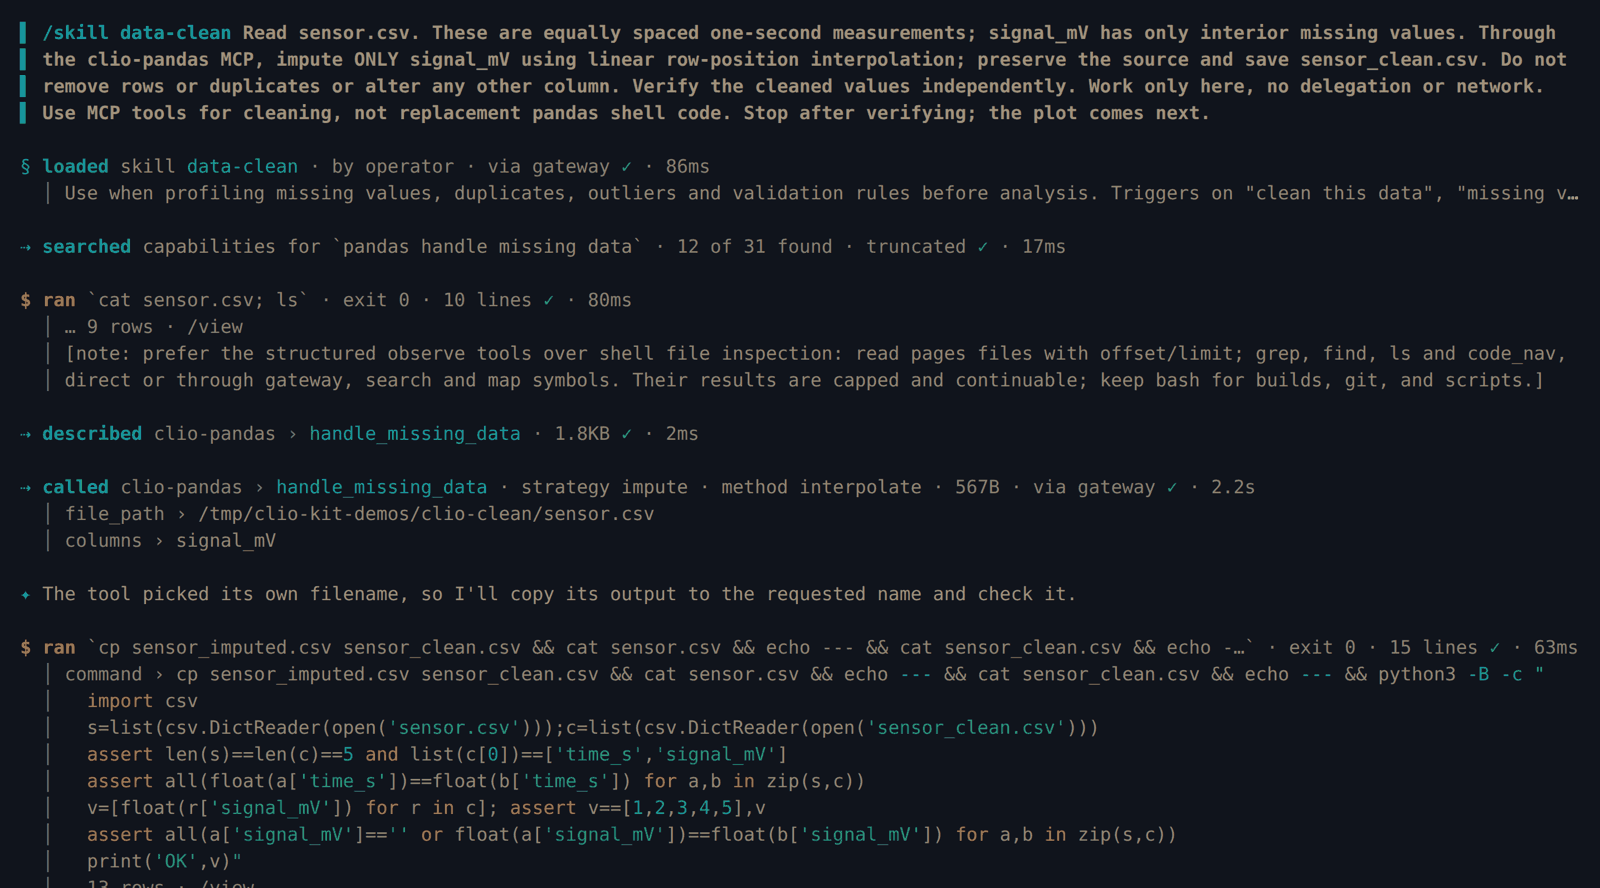
/skill activates exactly one skill for a turn, so use two turns. First the
repair:
/skill data-clean Read sensor.csv. These are equally spaced one-second measurements; signal_mV has only interior missing values. Through the clio-pandas MCP, impute ONLY signal_mV using linear row-position interpolation; preserve the source and save sensor_clean.csv. Do not remove rows or duplicates or alter any other column. Verify the cleaned values independently. Work only here, no delegation or network. Use MCP tools for cleaning, not replacement pandas shell code. Stop after verifying; the plot comes next.
Then the handoff to Plot:
/skill results-summary Use the clio-plot MCP on sensor_clean.csv to make signal.png, and write cleaning-report.md stating the method, values, units and output paths. Work only here, no delegation or network. Use MCP tools for plotting, not replacement matplotlib shell code.
Save this as opencode.json in the project:
{
  "$schema": "https://opencode.ai/config.json",
  "mcp": {
    "clio-pandas": {
      "type": "local",
      "command": ["clio-kit", "mcp-server", "pandas"],
      "enabled": true,
      "timeout": 120000
    },
    "clio-plot": {
      "type": "local",
      "command": ["clio-kit", "mcp-server", "plot"],
      "enabled": true,
      "timeout": 120000
    }
  }
}
clio-kit skill install data-clean --target .agents/skills
clio-kit skill install results-summary --target .agents/skills
opencode
Paste:
Use the data-clean skill first, then the results-summary skill. Read sensor.csv. These are equally spaced one-second measurements; signal_mV has only interior missing values. Through the clio-pandas MCP, impute ONLY signal_mV using linear row-position interpolation; preserve the source and save sensor_clean.csv. Do not remove rows or duplicates or alter any other column. Verify the cleaned values independently. Then use the clio-plot MCP on the cleaned file to make signal.png, and write cleaning-report.md stating the method, values, units and output paths. Work only here, no delegation or network. Use MCP tools for cleaning and plotting, not replacement pandas or matplotlib shell code.
3. Inspect the transformation
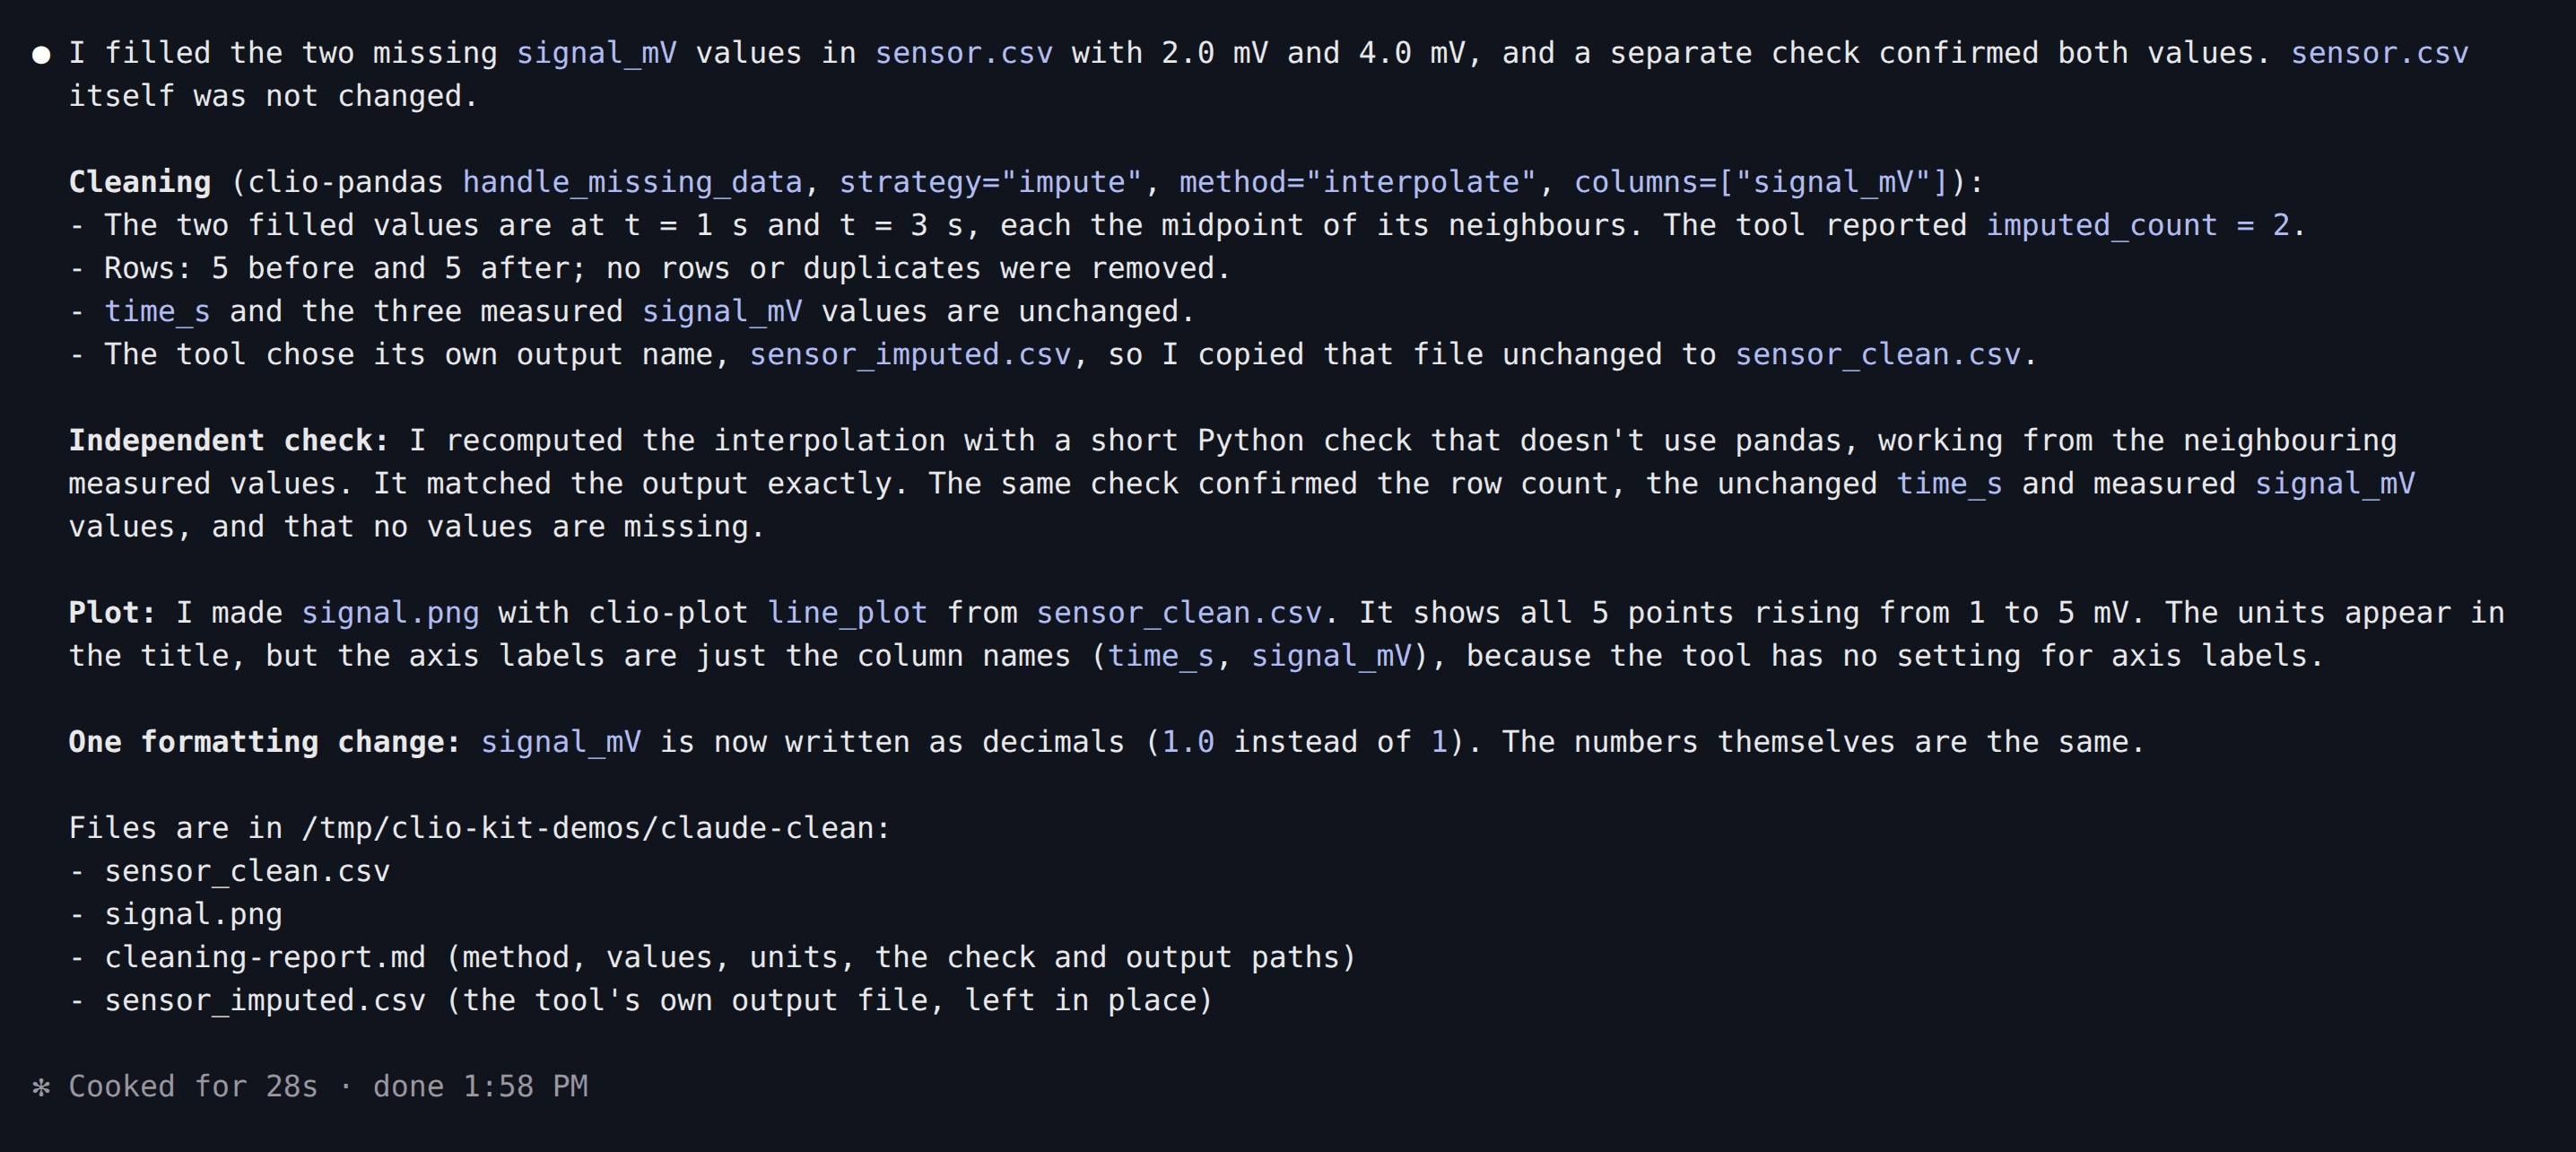
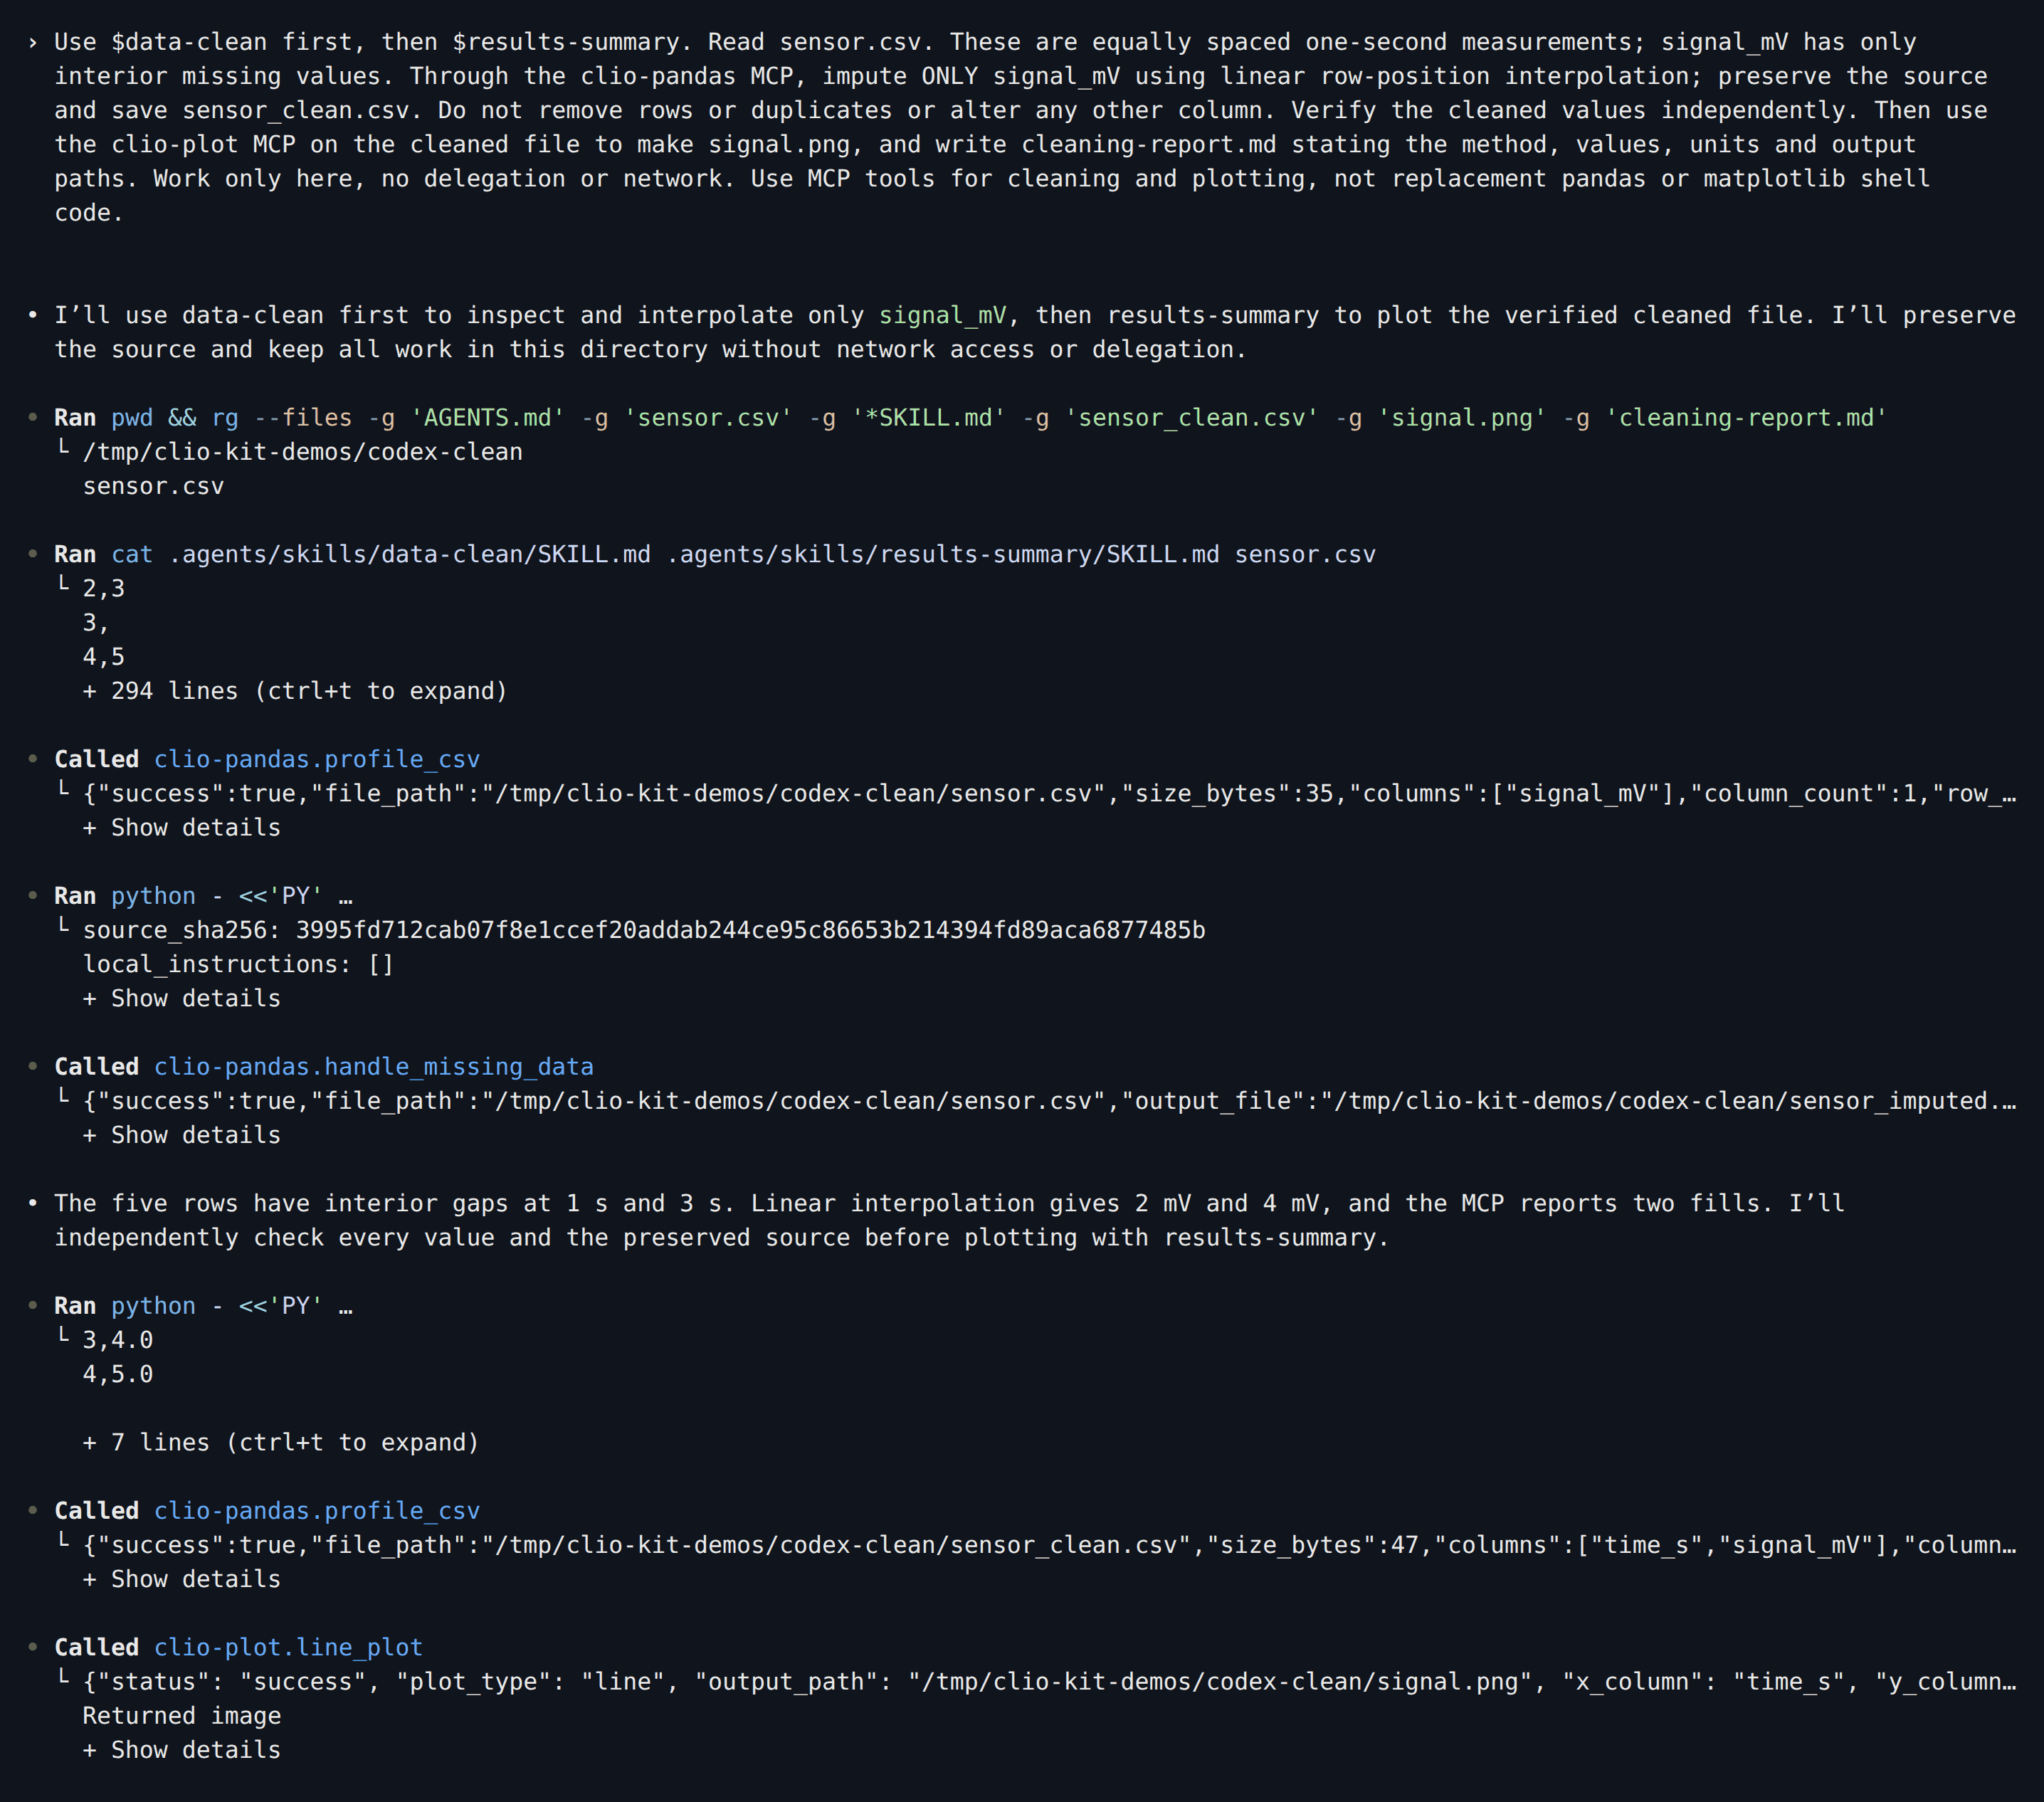
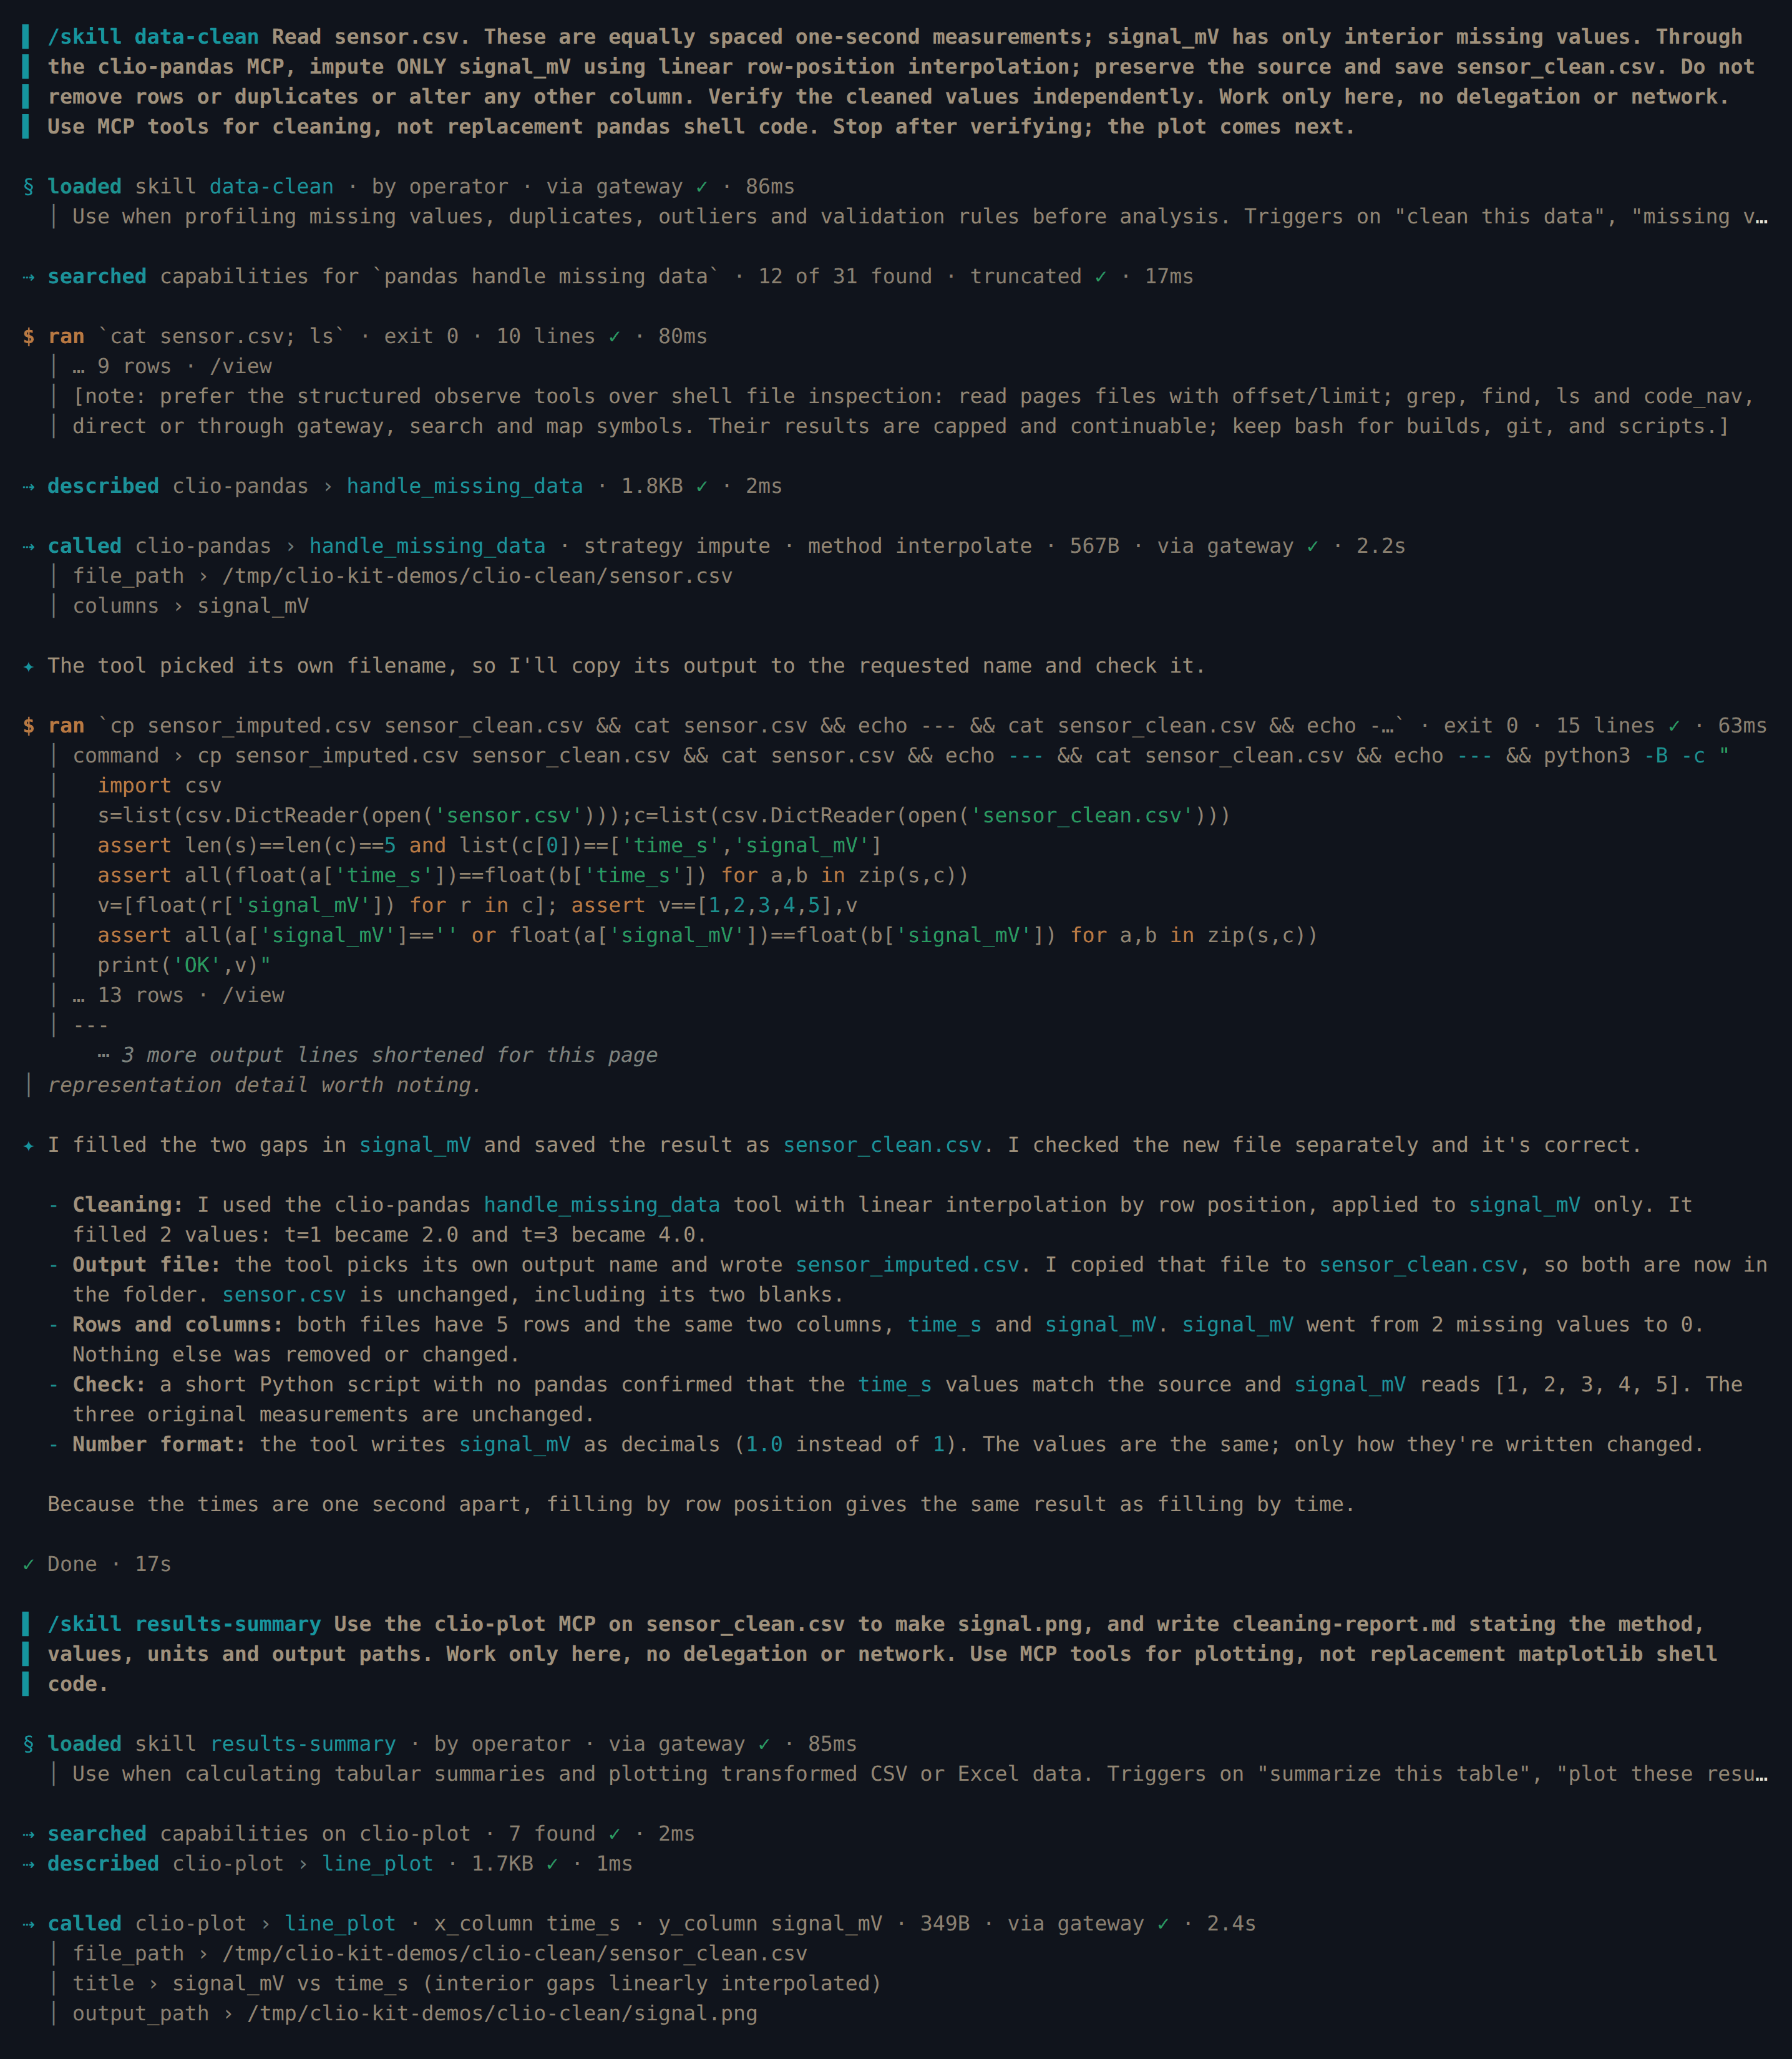
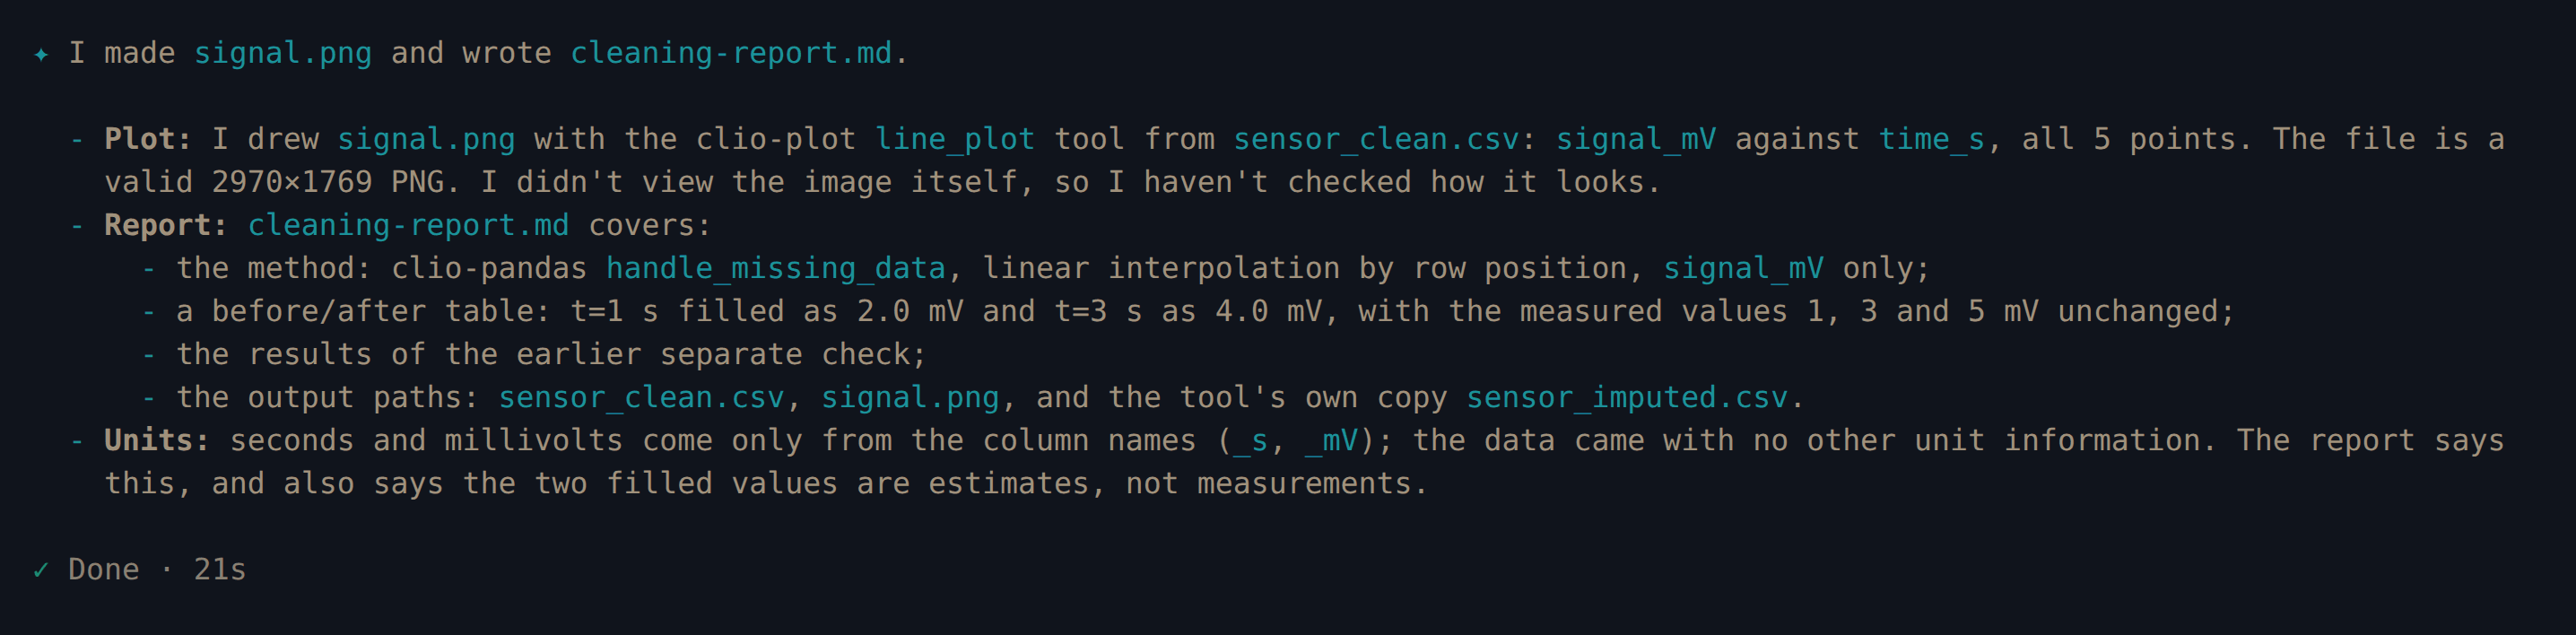
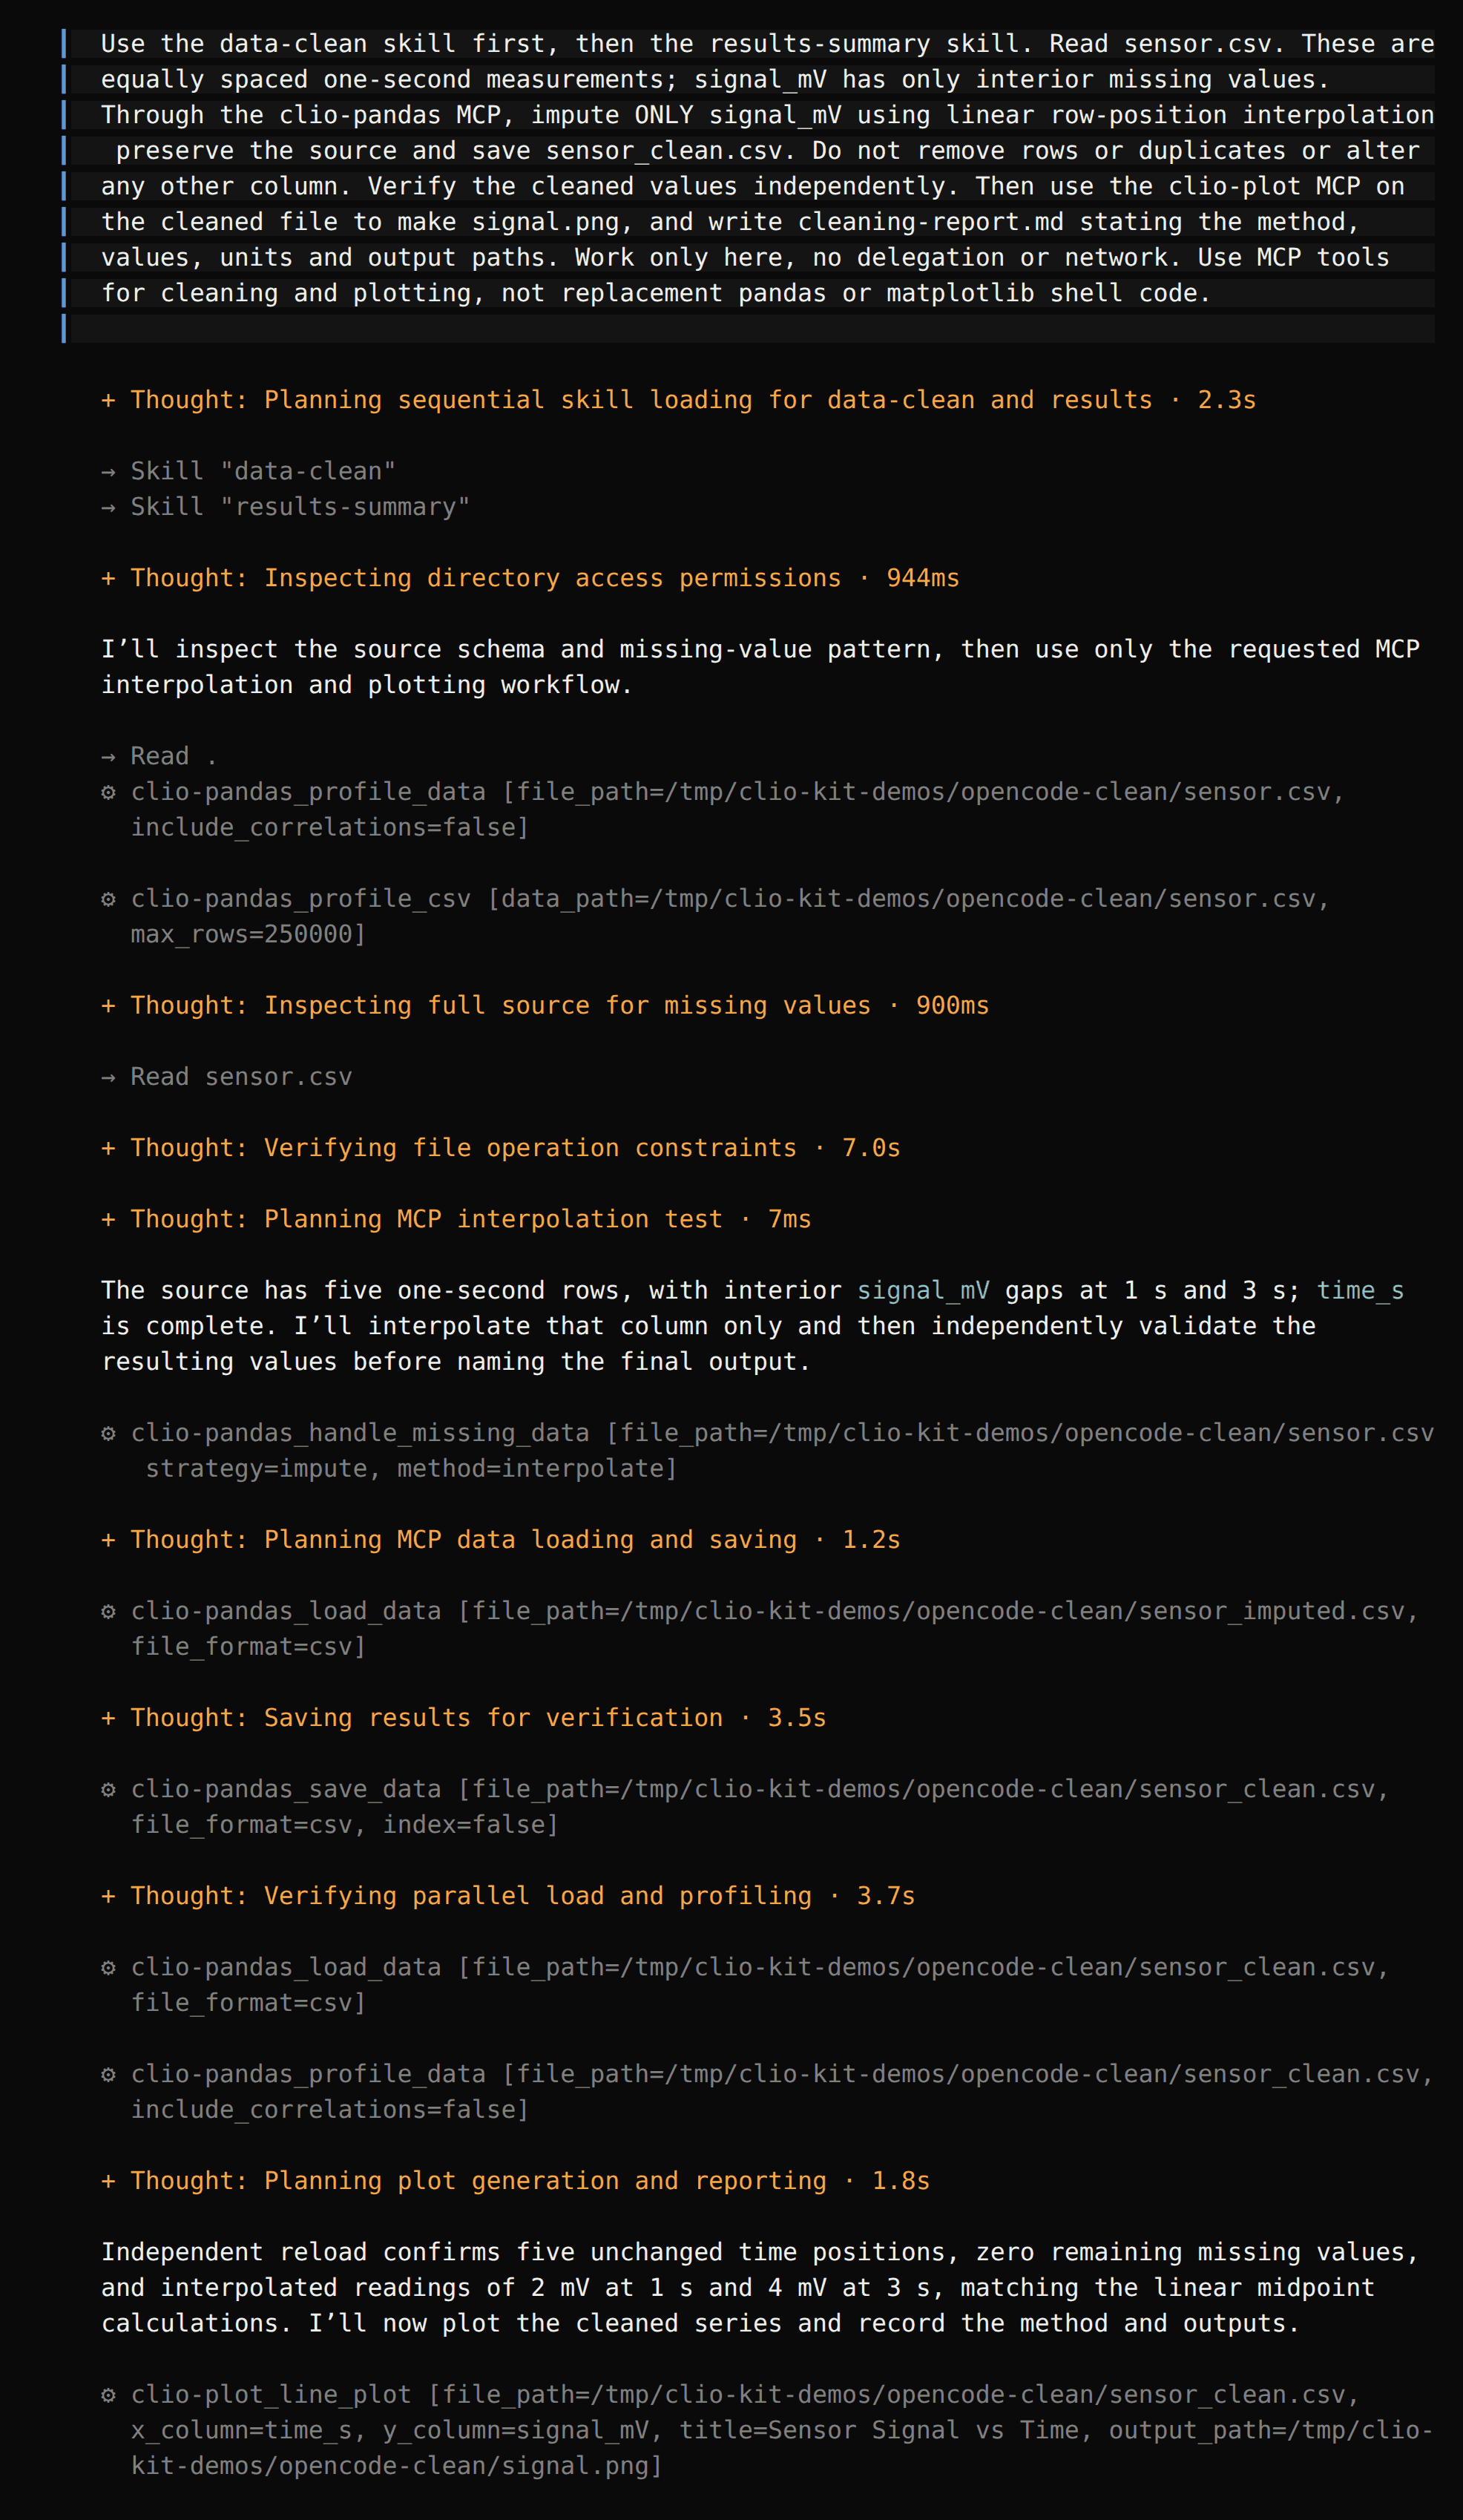
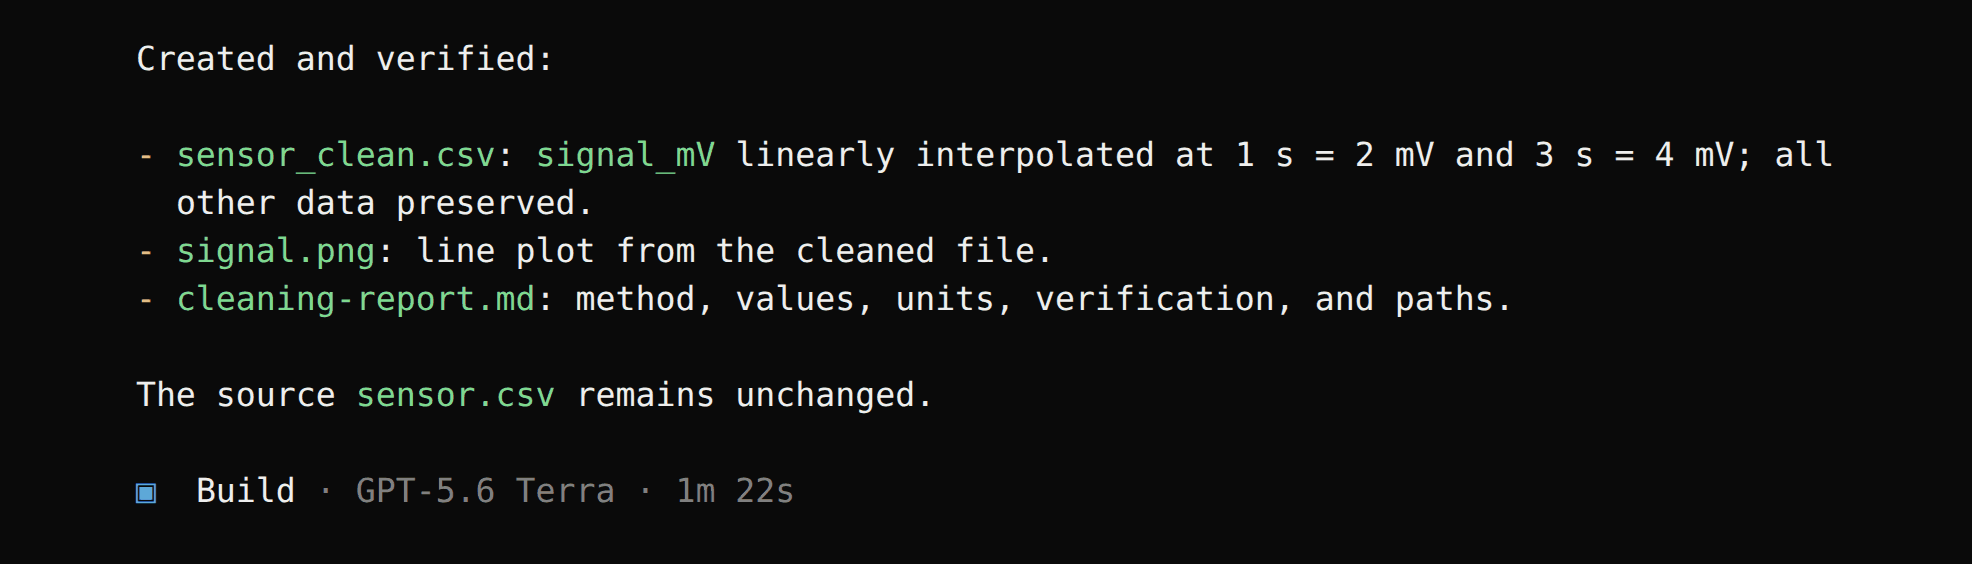
In all four sessions the Pandas handle_missing_data tool filled the gaps and
wrote its output to sensor_imputed.csv; the agent then saved the requested
sensor_clean.csv. The second skill tells the agent to plot the cleaned file,
not the original input, and every client passed sensor_clean.csv to
line_plot.
cat sensor.csv
cat sensor_clean.csv
cat cleaning-report.md
Check that the source still has its two empty cells. The cleaned signals should
be 1, 2, 3, 4, 5, with timestamps 0, 1, 2, 3, 4 and exactly five rows. The
two interpolations are (1+3)/2 = 2 and (3+5)/2 = 4. We checked these values
and the unchanged source in all four recorded projects.
4. Open the figure
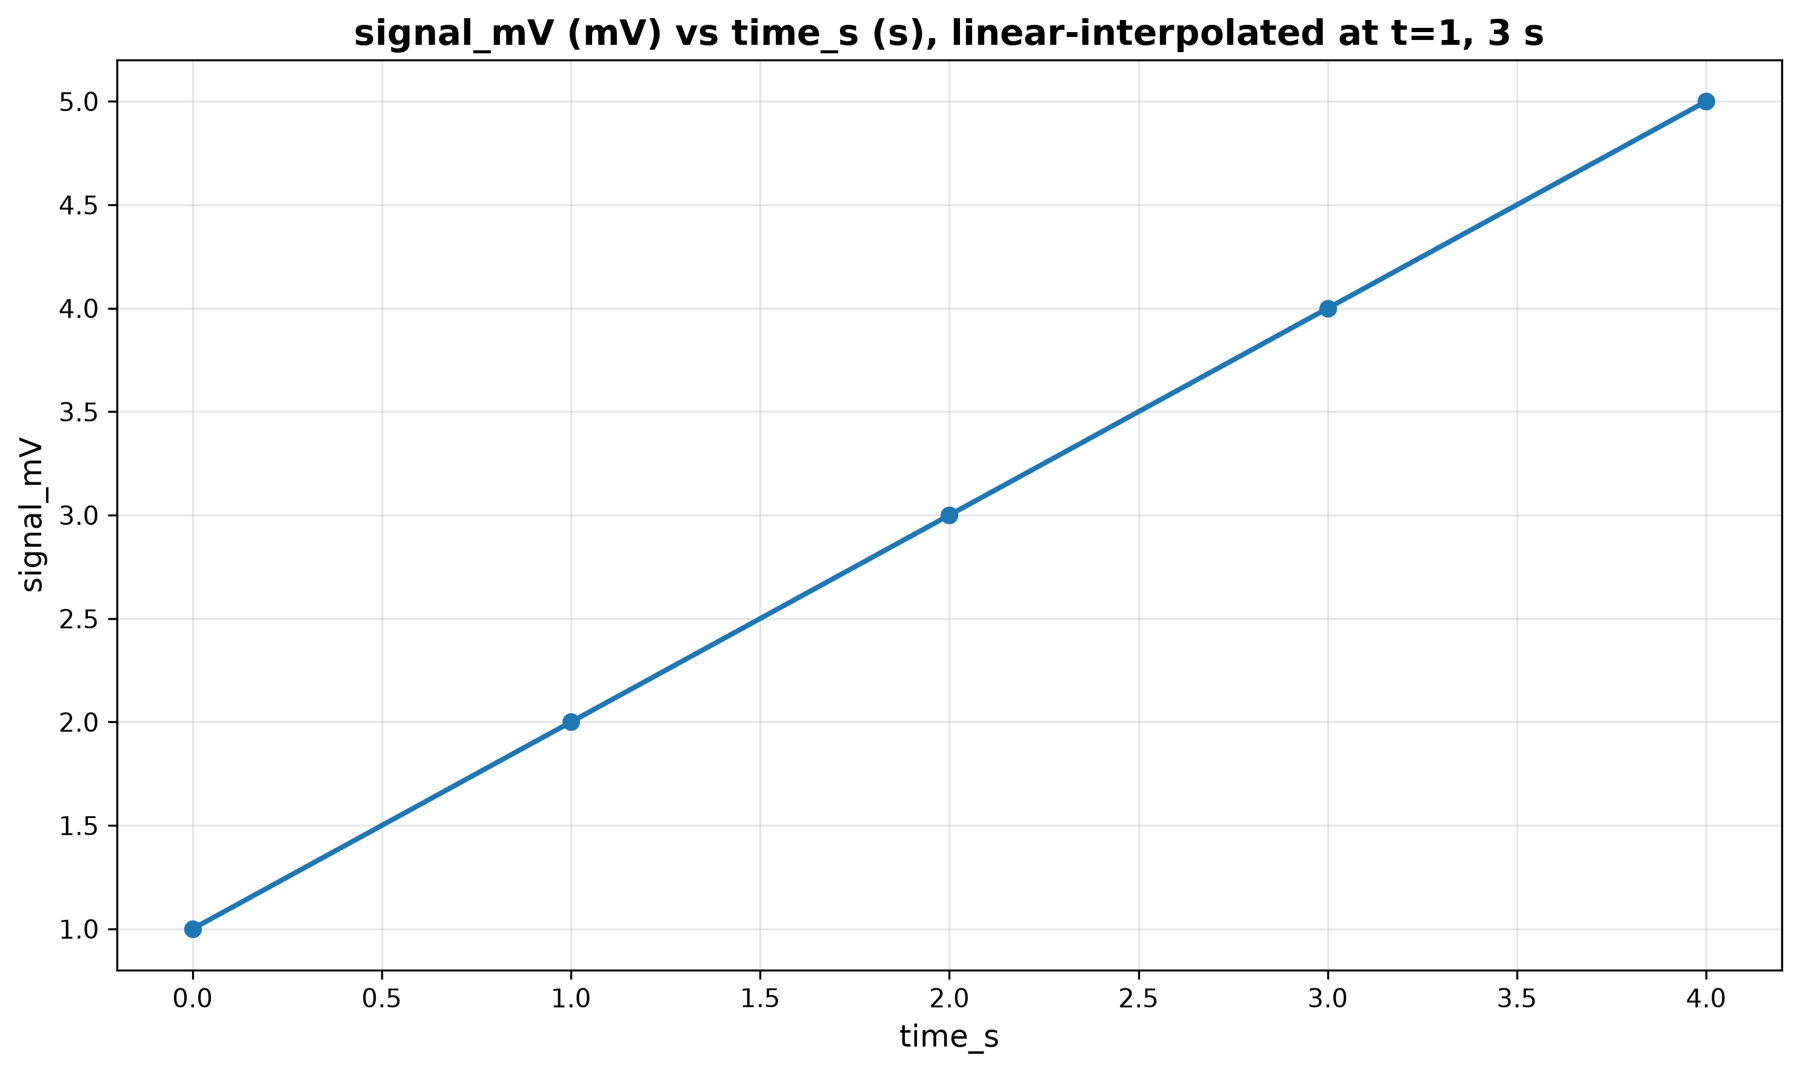
This is the signal.png from the Claude Code session; the other clients plotted
the same five cleaned points. A smooth line does not prove a repair
is scientifically justified: check the values, the chosen method and the
measurement process. Row-position interpolation is not a time-aware method for
irregular timestamps.
Next: compare grouped experiment results, or choose a storage layout.