CLIO Kit / Demos
Watch an agent work with scientific data.
These demos use an older version of CLIO Kit. Each one shows the requests that started the session and the files it produced.
01 / ParaView MCP
Render a pipe-flow simulation
in a live ParaView session.
The agent loads an InCompact3d BP5 dataset into ParaView, adds pressure and velocity isosurfaces and three orthogonal slices, and saves a screenshot after each step.
- Version
- Older CLIO Kit, then called Agent Toolkit
- Recorded
- November 2025
- Agent
- Claude Code · Sonnet 4.5
- Data
- InCompact3d pipe flow, BP5 · ParaView 5.13.1
What was asked
- Load and analyze the BP5 dataset from @bp5-dataset-collection/InCompact3d/Pipe-Flow/data.bp5 and perform comprehensive fluid dynamics visualization. Context: This is a computational fluid dynamics dataset containing pressure and velocity field data from a pipe flow simulation.
- Load the BP5 dataset and examine available fields and data structure.
- Create an isosurface visualization for pressure (pp) field at value 0.1 with appropriate color mapping.
- Create three orthogonal slice planes for comprehensive flow analysis: Y-normal slice (horizontal plane) at origin, Z-normal slice (vertical plane) at origin, X-normal slice (front view) at origin.
- Create an isosurface for velocity magnitude using ux field at value 0.5 with distinct coloring.
MCP calls in the recording
load_scientific_datagenerate_isosurfacecreate_data_sliceset_representation_typeapply_field_coloringset_active_source
What it demonstrates
Showcase of IOWarp’s ParaView MCP integration for comprehensive computational fluid dynamics (CFD) visualization, demonstrating automated analysis and rendering of BP5 datasets from pipe flow simulations.
- CFD Data Analysis: Processing BP5 files from InCompact3d pipe flow simulations containing pressure and velocity fields
- Automated Visualization Pipeline: Creating sophisticated visualizations through natural language commands without manual ParaView GUI interaction
- Isosurface Generation: Rendering pressure and velocity magnitude isosurfaces to identify critical flow features
- Multi-Plane Slicing: Generating orthogonal slice planes (X, Y, Z) for comprehensive three-dimensional flow field analysis
- Interactive Rendering: Producing high-quality visualizations with appropriate color mapping for scientific interpretation
The demo showcases how IOWarp’s ParaView MCP integration enables researchers to perform complex 3D visualization tasks using simple natural language instructions, making advanced CFD analysis more accessible and streamlining the workflow from data to publication-ready visualizations.
Use the current ParaView server →What it produced
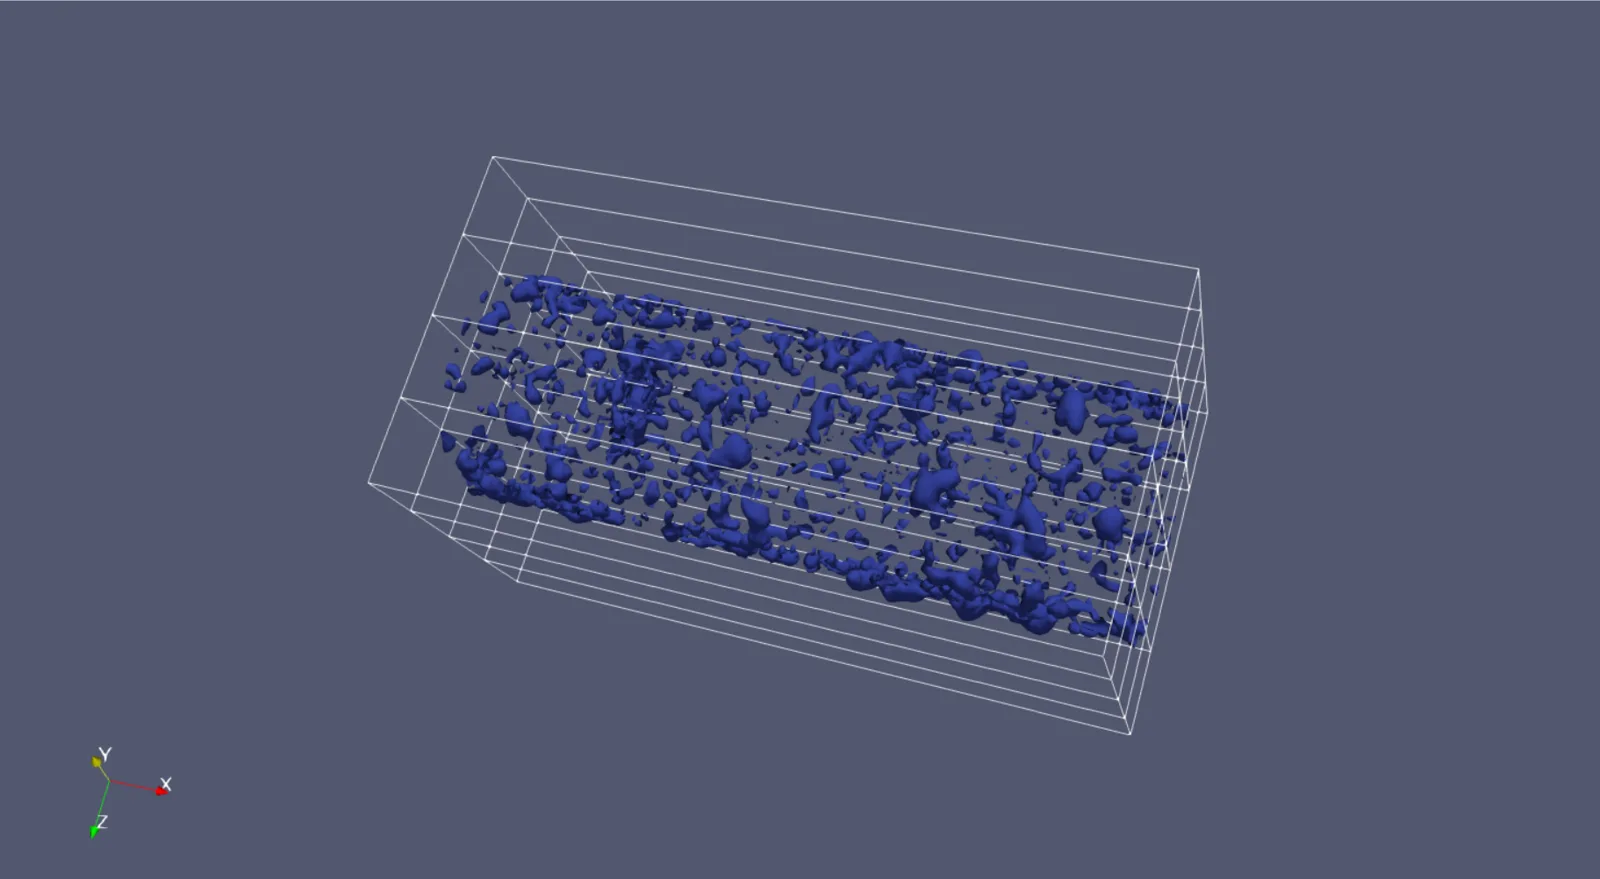
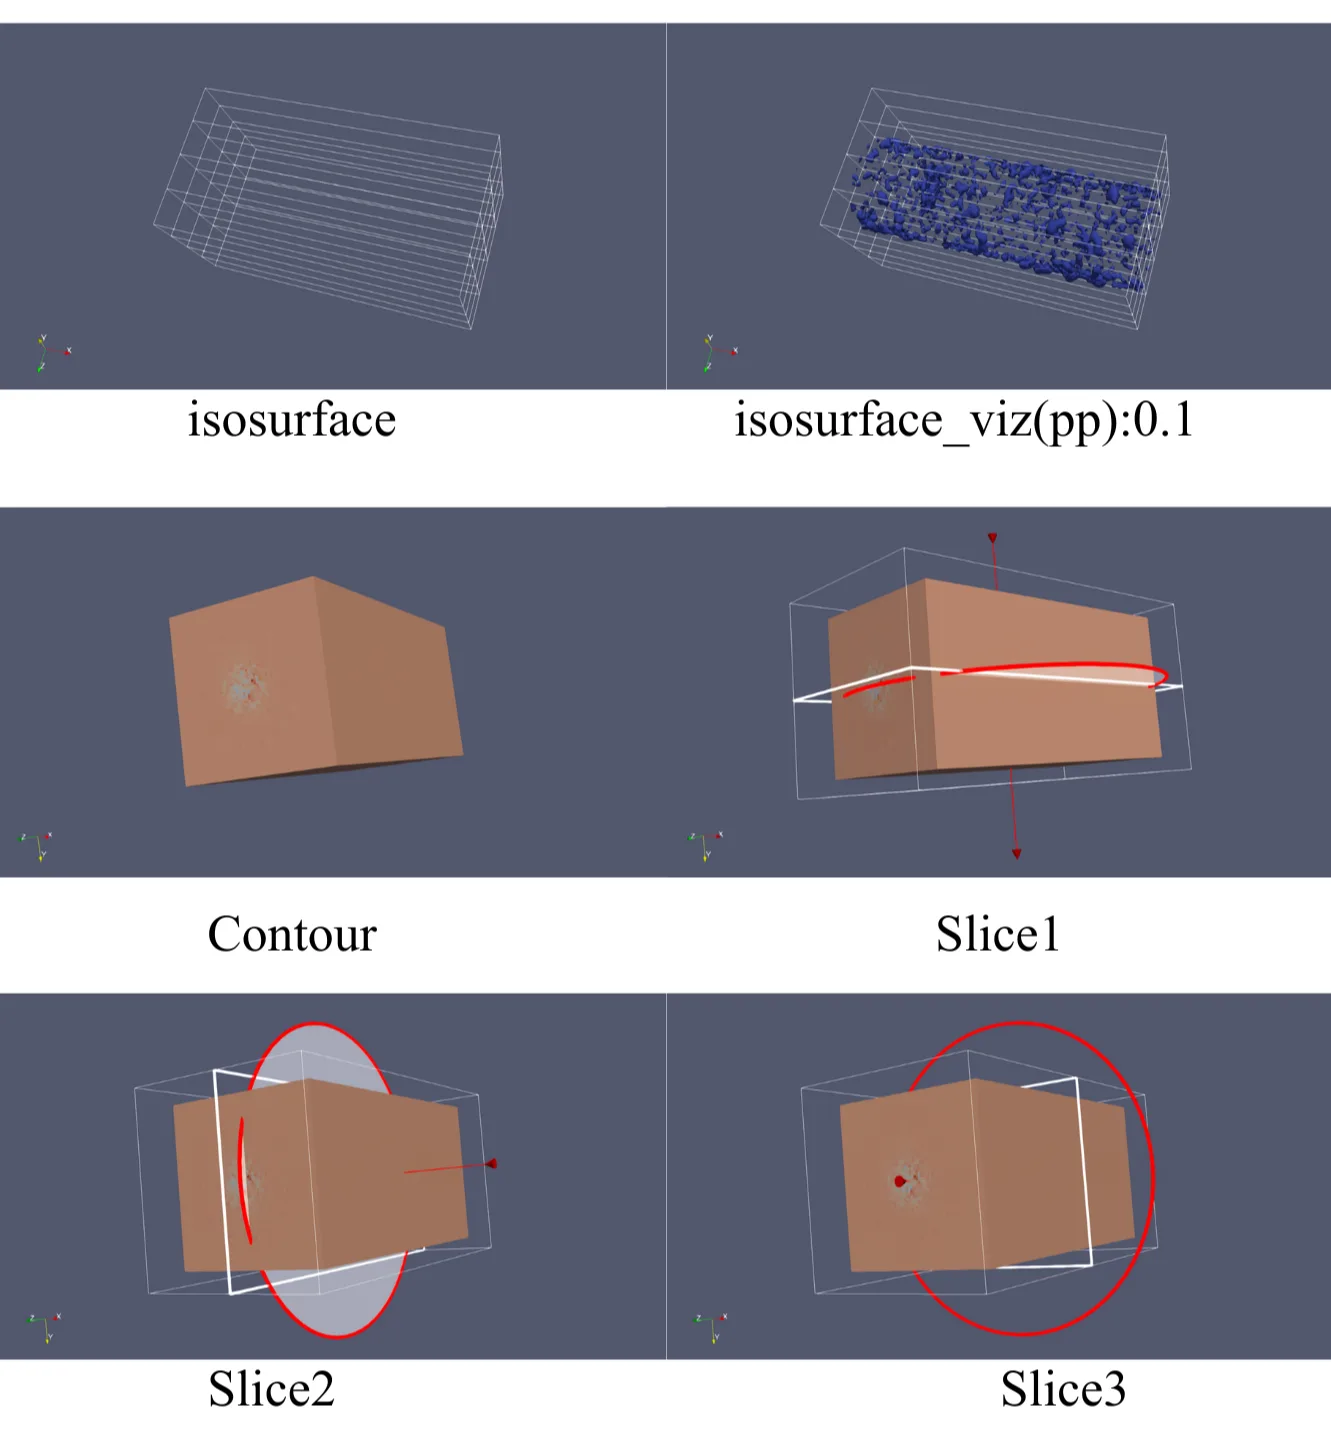
isosurface_pipeflow_visual.png The pressure isosurface at pp = 0.1.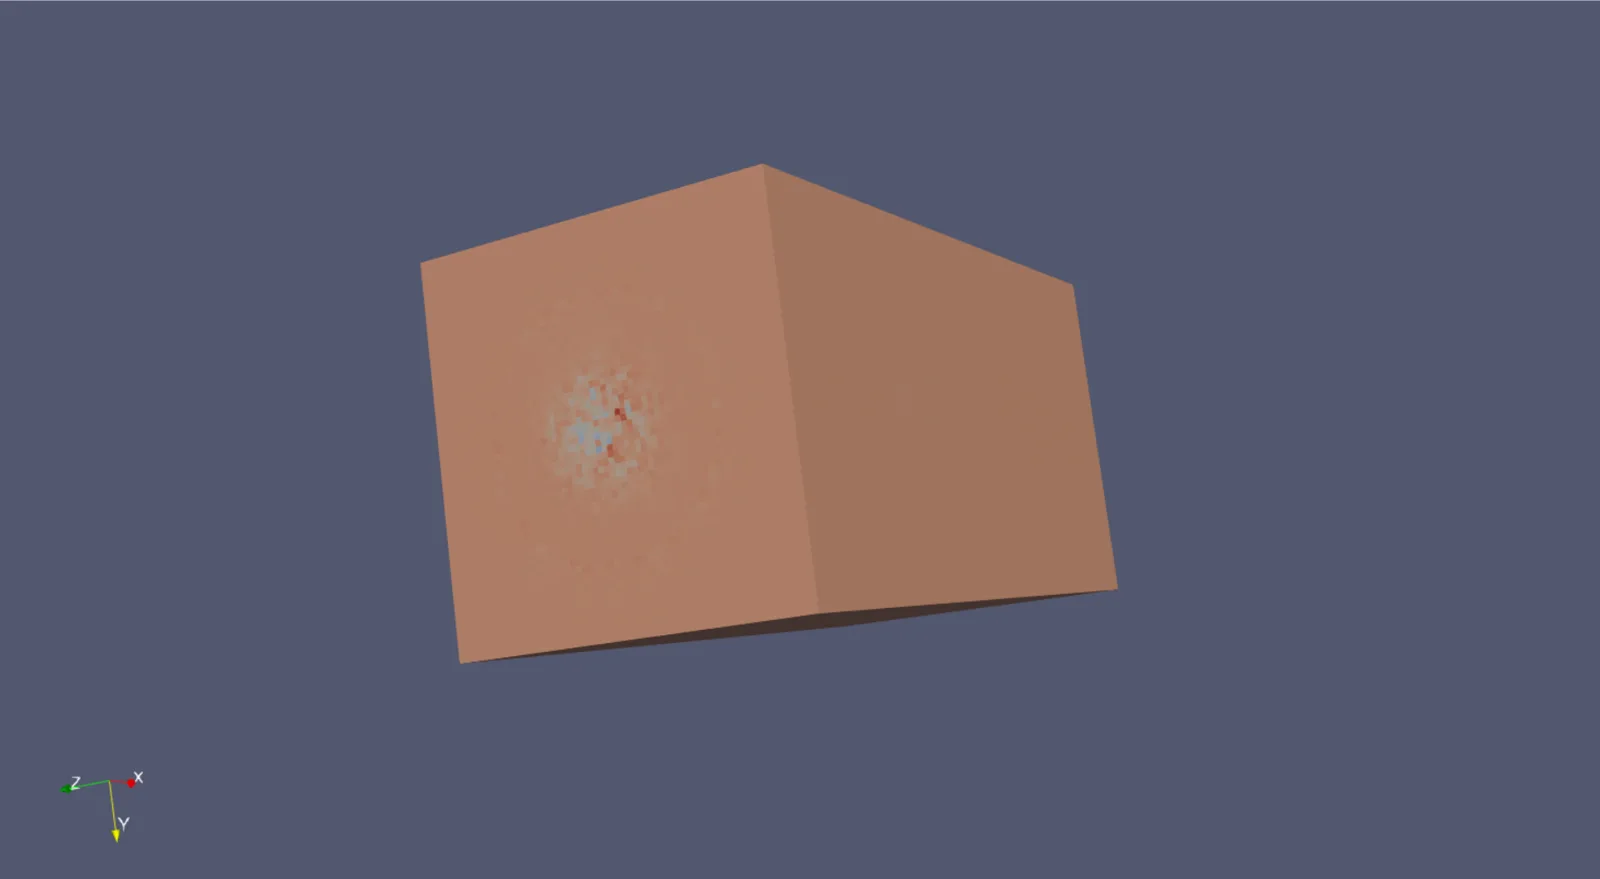
contour.png The Contour1 filter rendered as a surface.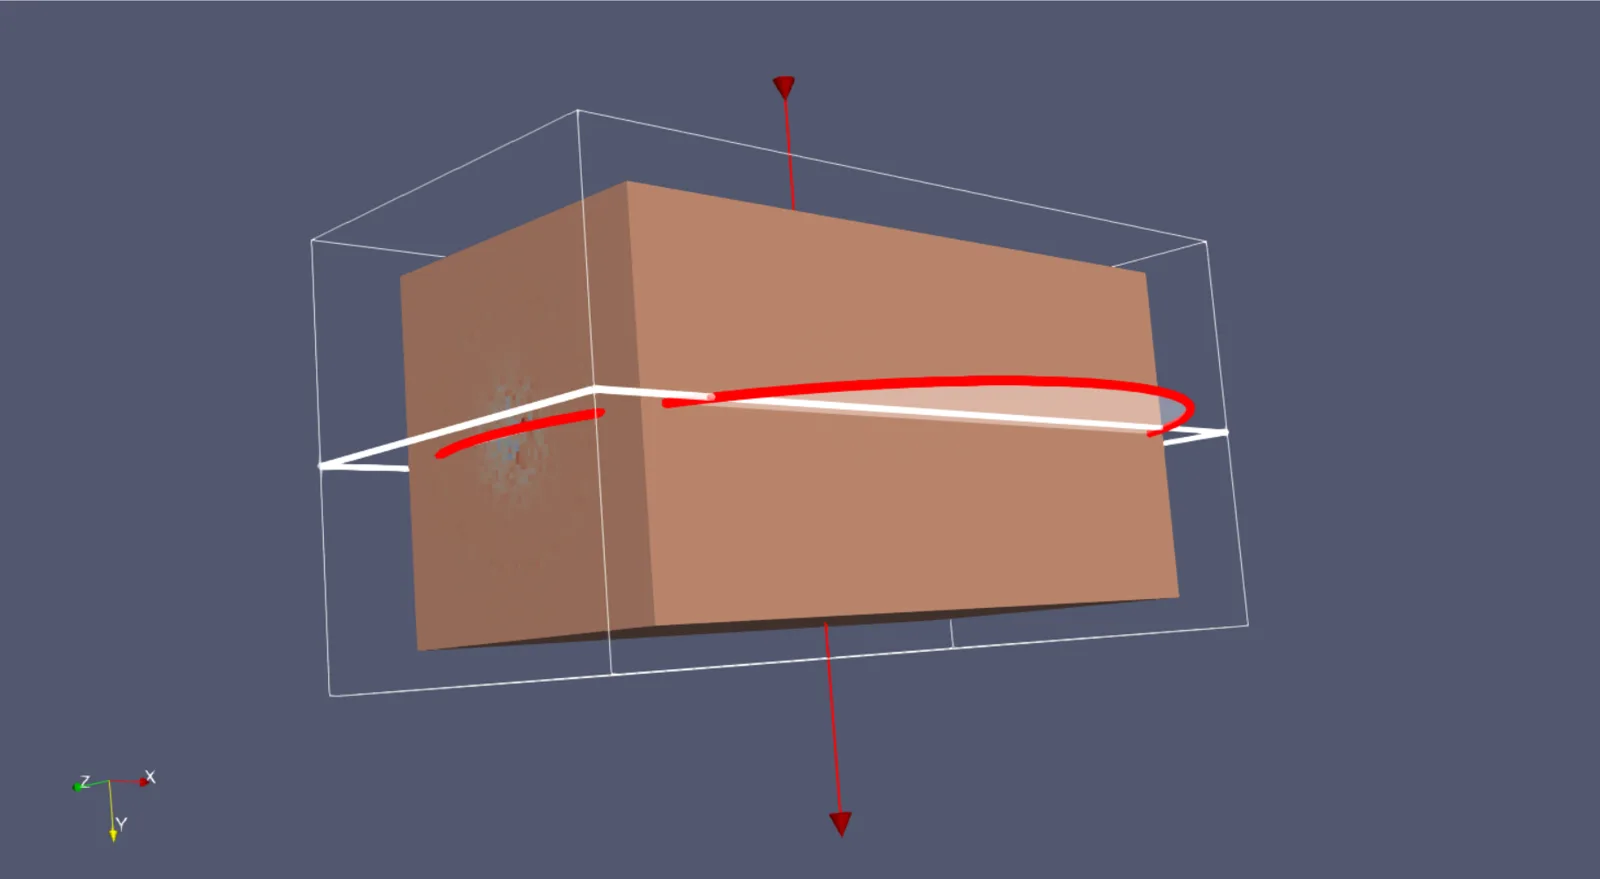
slice1.png The Y-normal slice, Slice1.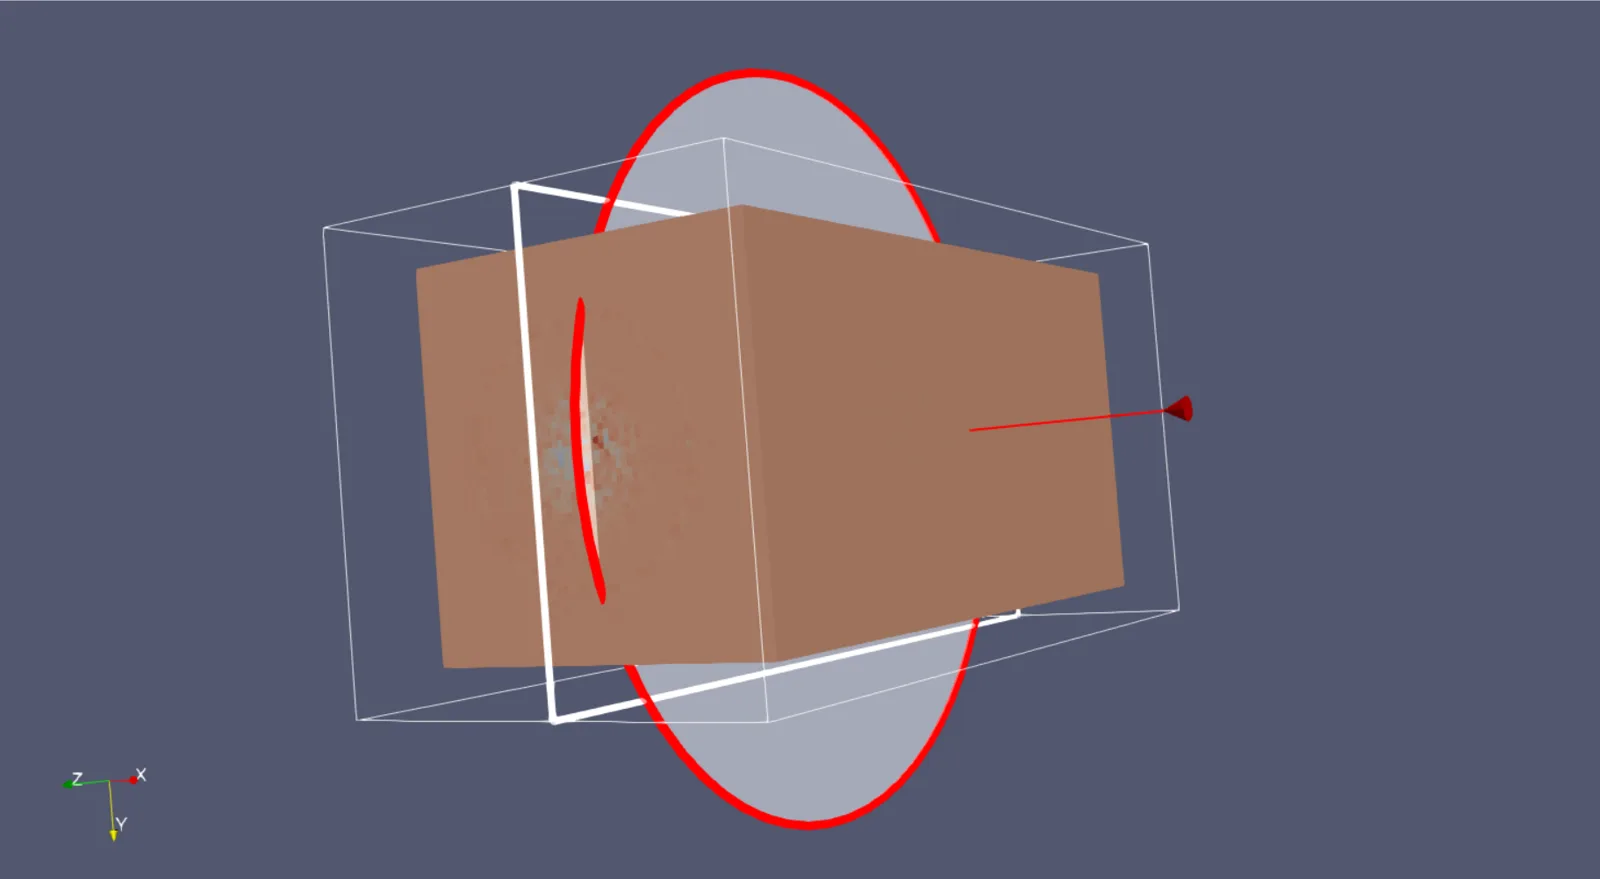
slice2.png The Z-normal slice, Slice2.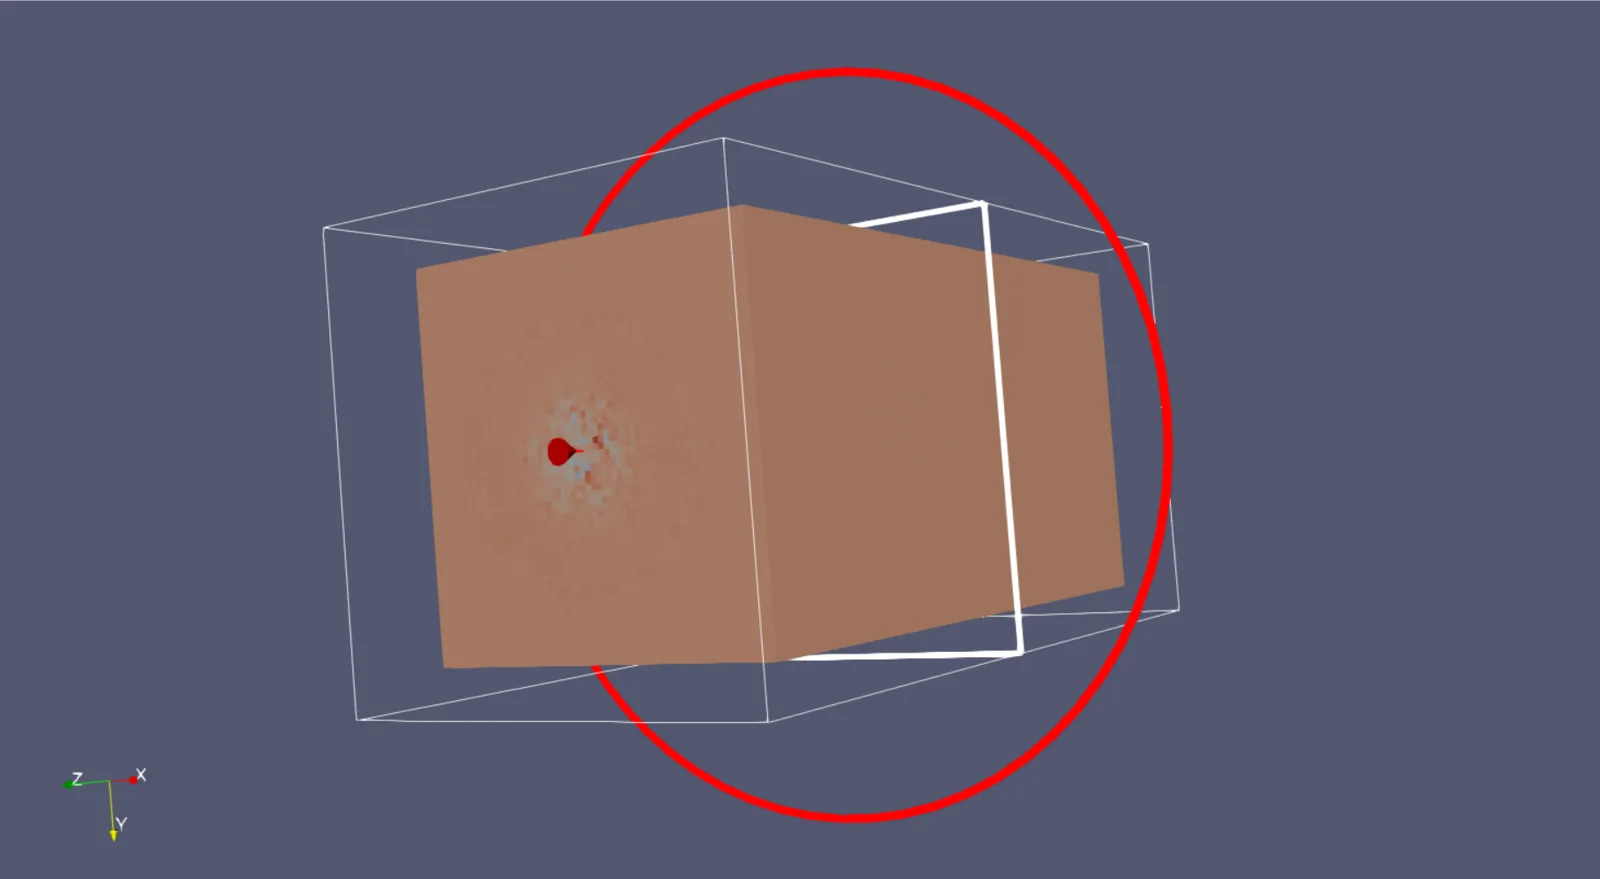
slice3.png The X-normal slice, Slice3.paraview_rander_output.png Six of the saved views on one labeled sheet.
02 / ADIOS2 MCP
Question a molecular dynamics run
in plain language.
The agent reads a LAMMPS gold-melting simulation through the ADIOS2 server, answers questions about the system, and plots the final atom positions and two single-atom trajectories.
- Version
- Older CLIO Kit, then called IOWarp MCPs
- Recorded
- September 2025
- Agent
- Claude Code
- Data
- LAMMPS gold-melting run, BP5
What was asked
- What can you tell me about the simulation based on the dataset.
- What was the initial temperature of the system?
- How many gold atoms are in the simulation?
- What are the dimensions of the simulation box?
- What is the total duration of the simulation in picoseconds?
- What is the crystal structure of the gold at the beginning of the simulation?
- Plot the positions of the atoms at the final timestep?
- Plot the trajectory of a single atom over time. The atom of choice should a parameter to the script. The output of the script should a PNG image with the results. Run the script for any single atom
MCP calls in the recording
list_bp5inspect_variablesinspect_attributesread_variable_at_step
What it demonstrates
Showcase of IOWarp ADIOS MCP providing full analysis of a BP5 file generated by LAMMPS, demonstrating natural language queries on scientific data.
- Scientific Data Interpretation: Analyzing BP5 files generated by LAMMPS molecular dynamics simulations
- Natural Language Queries: Enabling researchers to ask complex questions about simulation data in plain English
- Automated Analysis: Extracting key simulation parameters like temperature, atom count, box dimensions, and duration
- Visualization Generation: Creating plots and visualizations of atomic positions and trajectories
- Interactive Exploration: Providing an intuitive interface for exploring complex scientific datasets
The demo showcases how IOWarp’s ADIOS MCP can bridge the gap between complex scientific data formats and accessible analysis tools, making it easier for researchers to understand and visualize molecular dynamics simulations of gold melting processes.
Use the current ADIOS2 server →What it produced
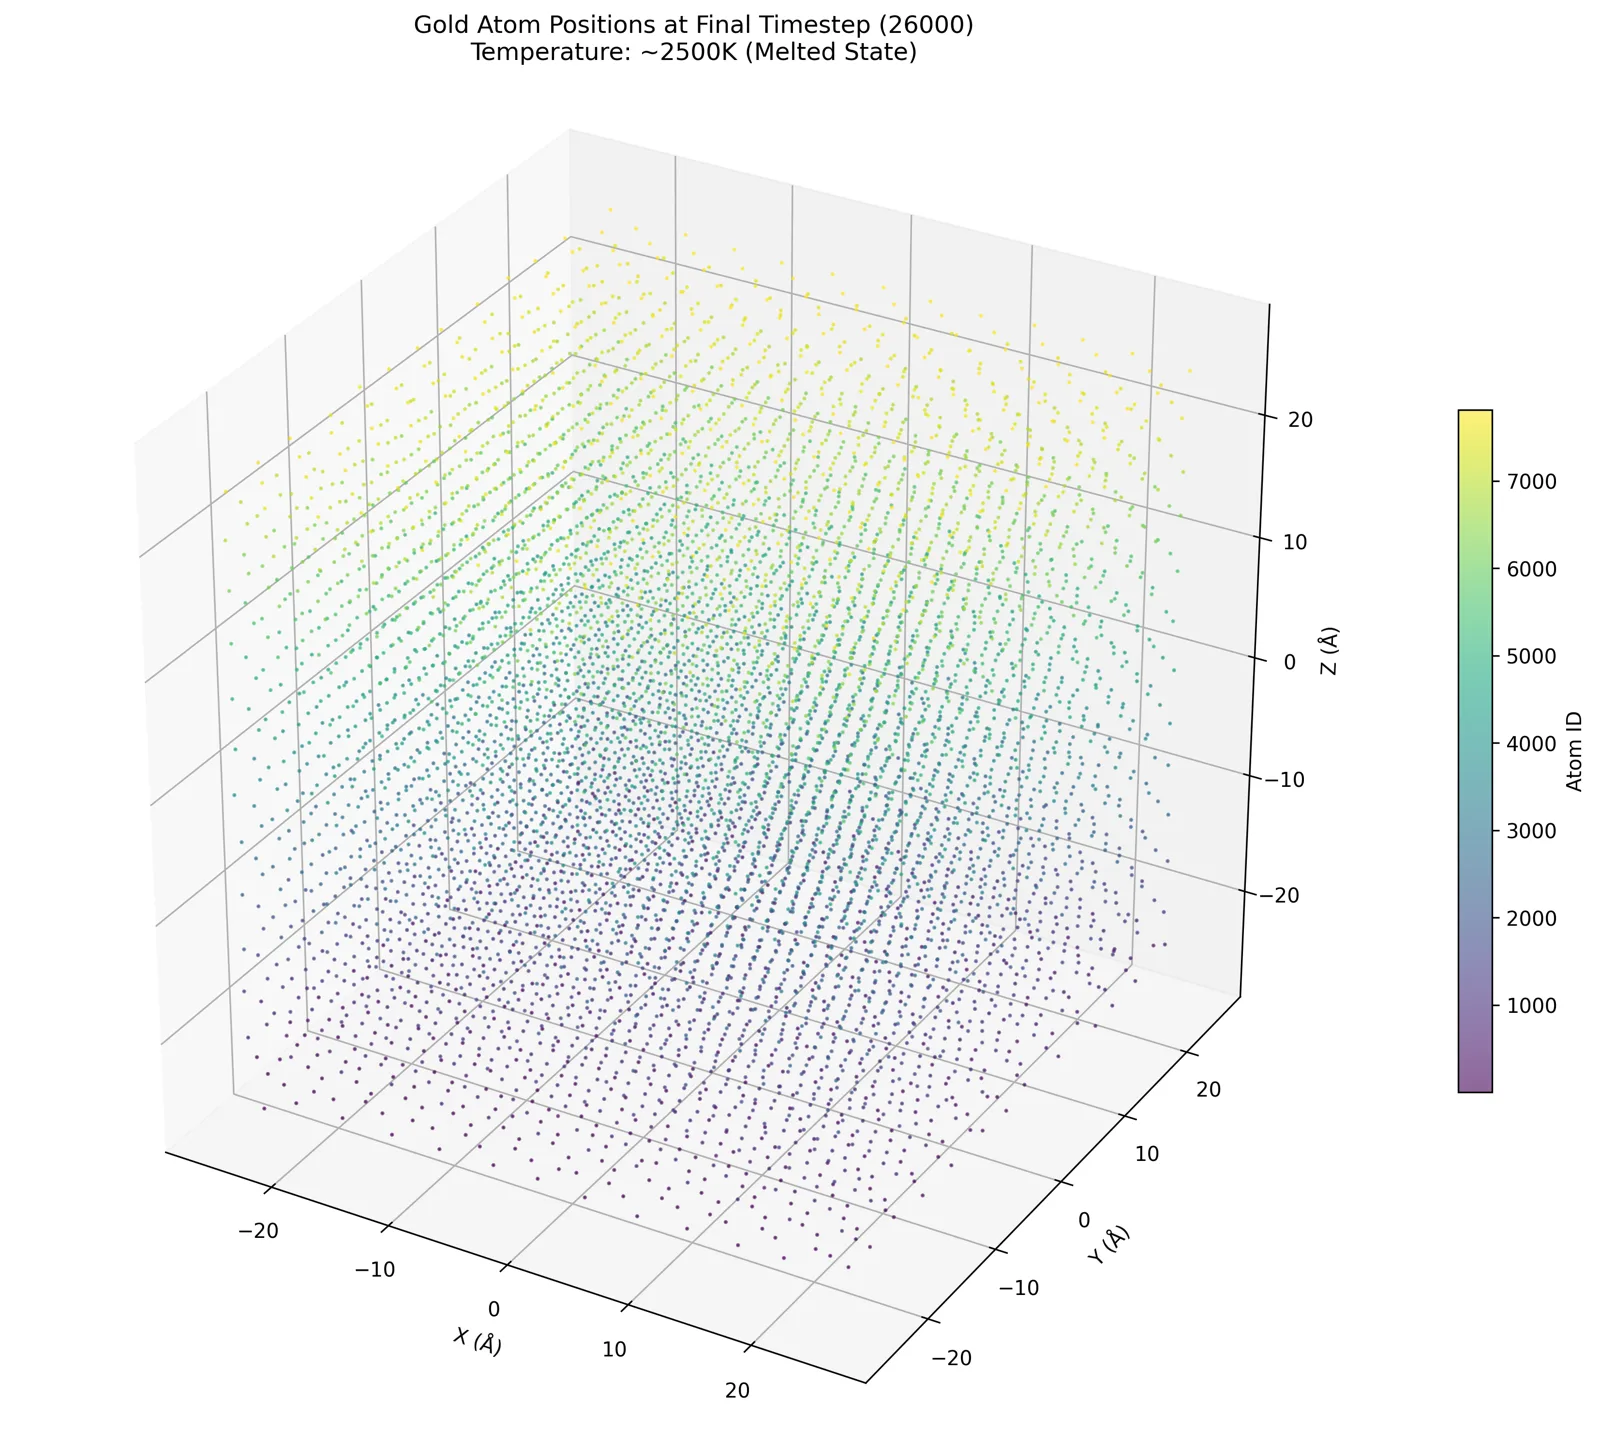
final_positions.png Atom positions at the final timestep, 26,000.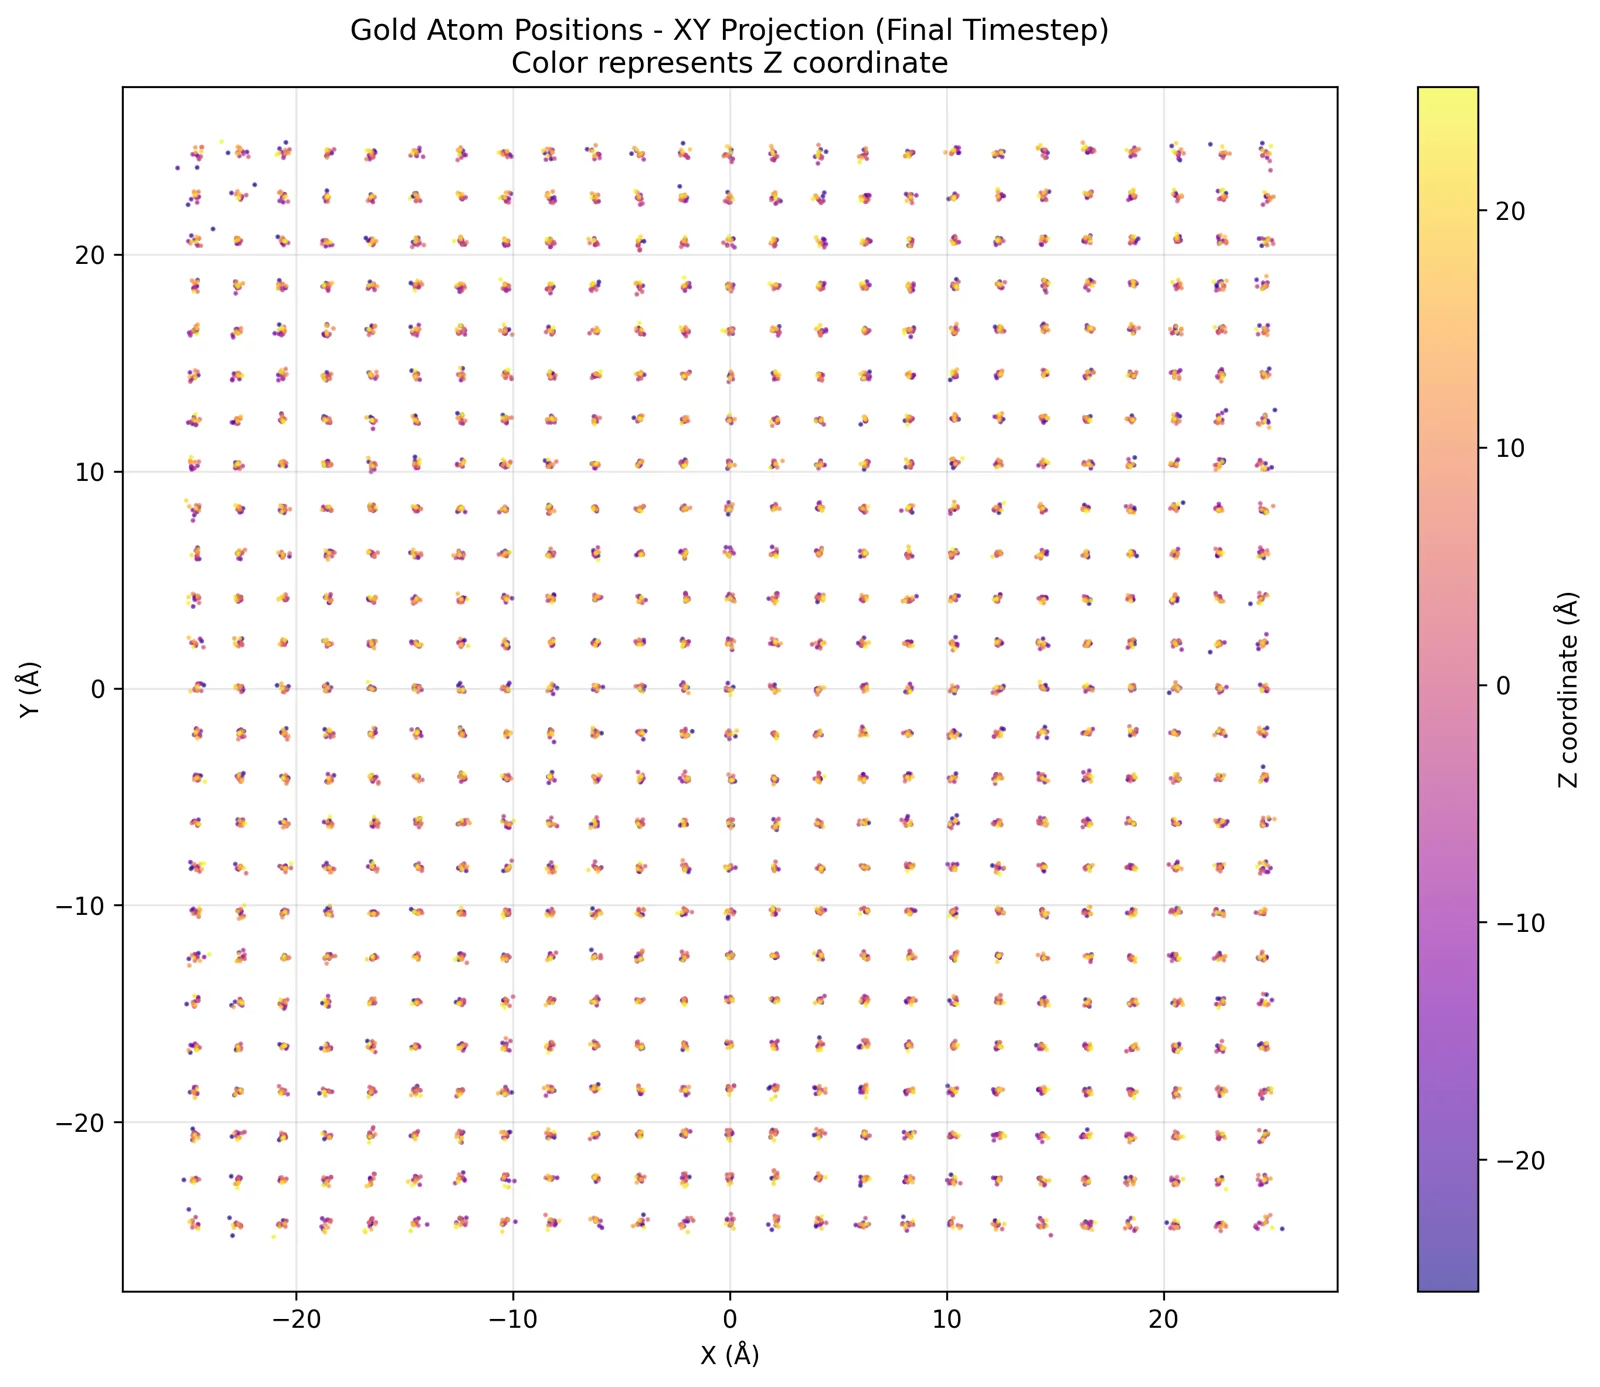
final_positions_xy.png The same positions projected onto x–y, colored by z.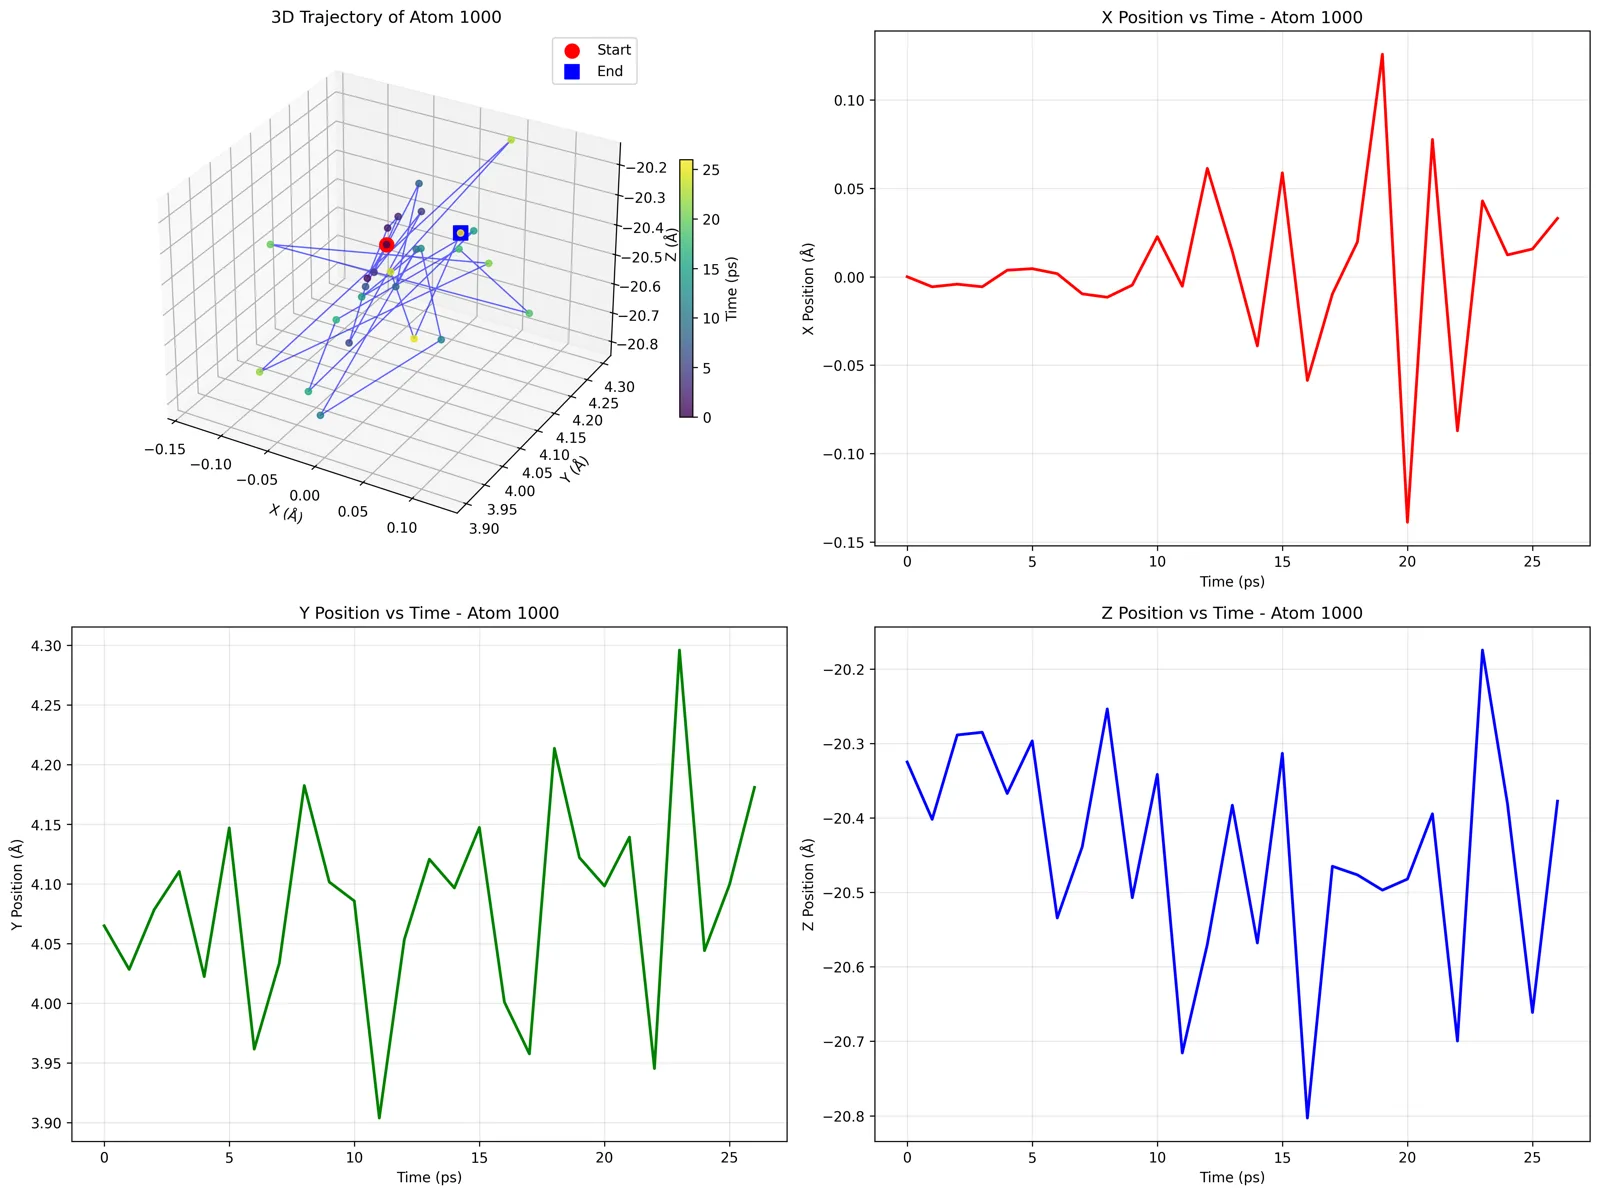
atom_1000_trajectory.png Trajectory of atom 1000.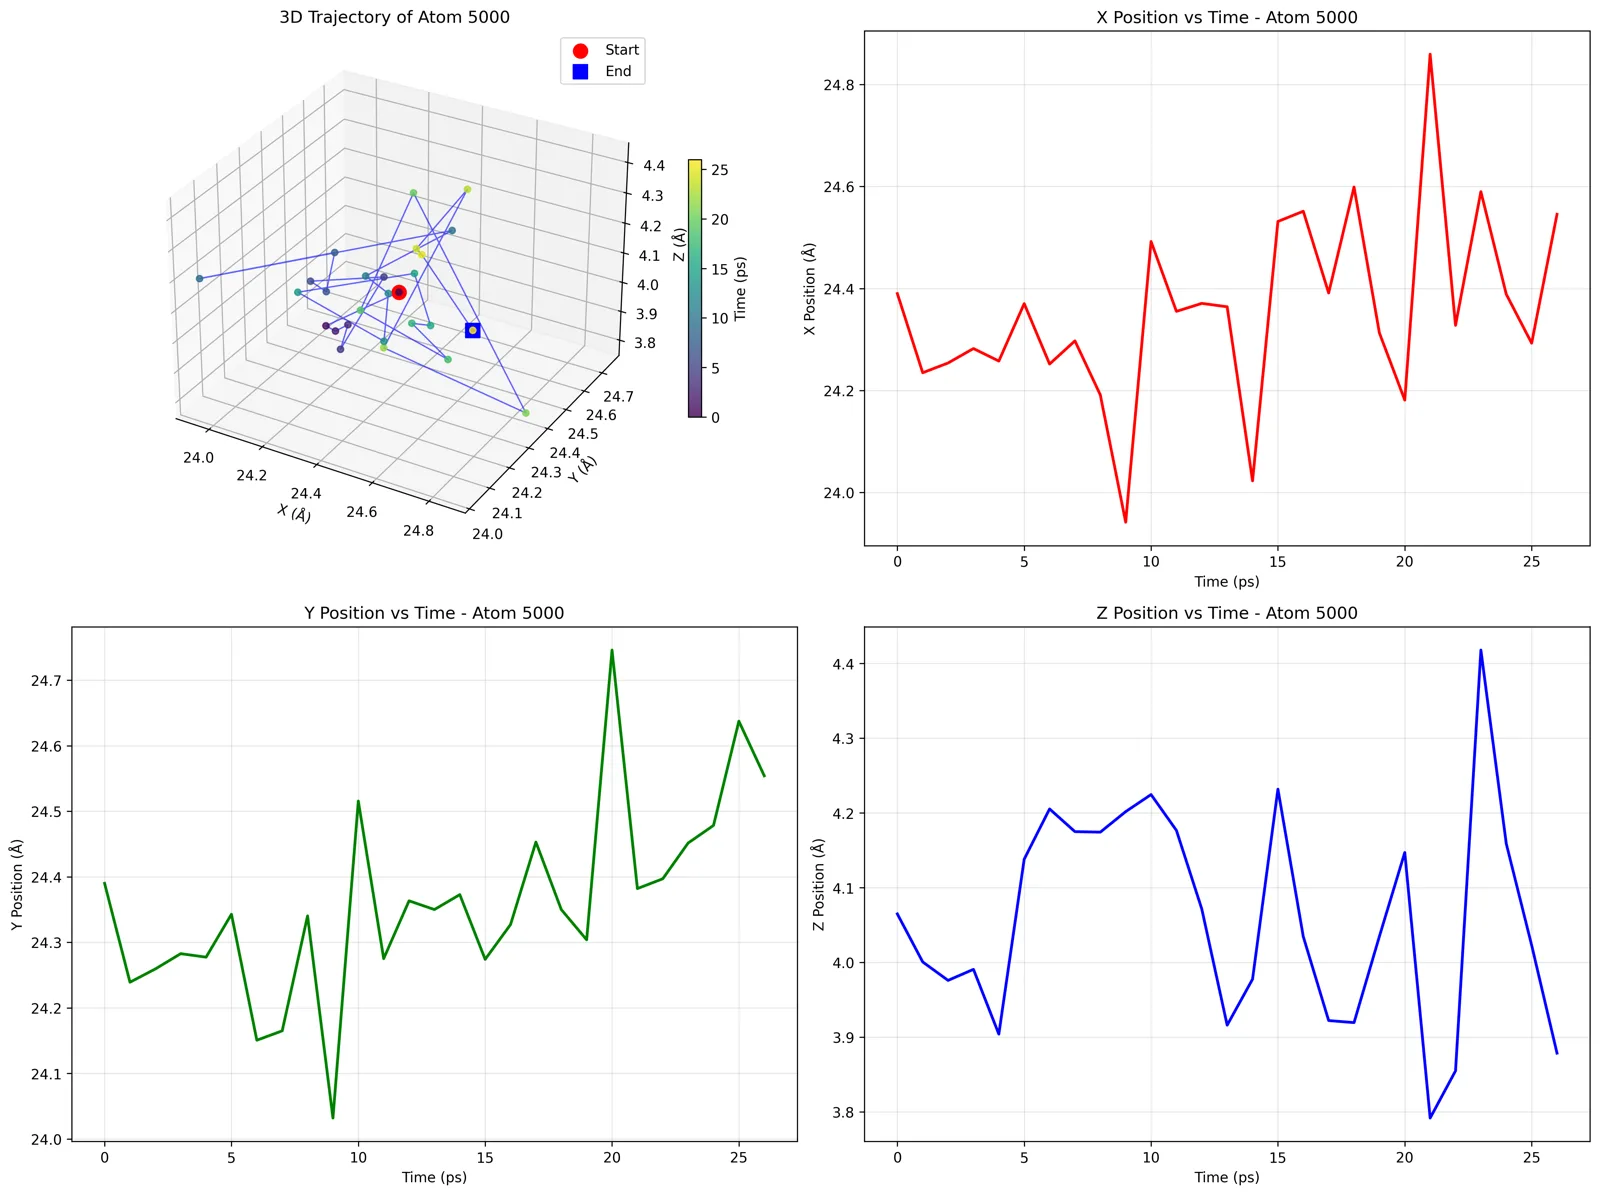
atom_5000_trajectory.png Trajectory of atom 5000.03 / NDP, Pandas and Plot MCPs
Find a dataset, explore it
and plot what it contains.
The agent finds the latest EarthScope dataset through the National Data Platform, downloads its GeoJSON metadata and GNSS time series, profiles the table, and writes a combined three-axis figure.
- Version
- Older CLIO Kit, then called IOWarp MCPs
- Recorded
- October 2025
- Agent
- Claude Code
- Data
- EarthScope GNSS station ODSA, 813,013 rows
What was asked
- Use the ndp-mcp to find the latest dataset of the earthscope organization, find the url of the geonjson and csv they contain, and curl them.
- The geojson is metadata, the csv contains seismograph data.
- Use the pandas-mcp to explore the csv file and understand the data.
- Use the plot-mcp to plot a line plot of each of the axis.
- Using uv to manage it, create a final plot that combines all of the axis as subgraphs into a single graph including as much information as possible from the gathered metadata.
MCP calls in the recording
ndp-mcp list_organizationspandas-mcp profile_dataplot-mcp line_plot
What it demonstrates
Showcase of NDP MCP providing full analysis of EarthScope seismograph data, demonstrating natural language queries on geophysical datasets with comprehensive visualization.
Use the current NDP server →What it produced
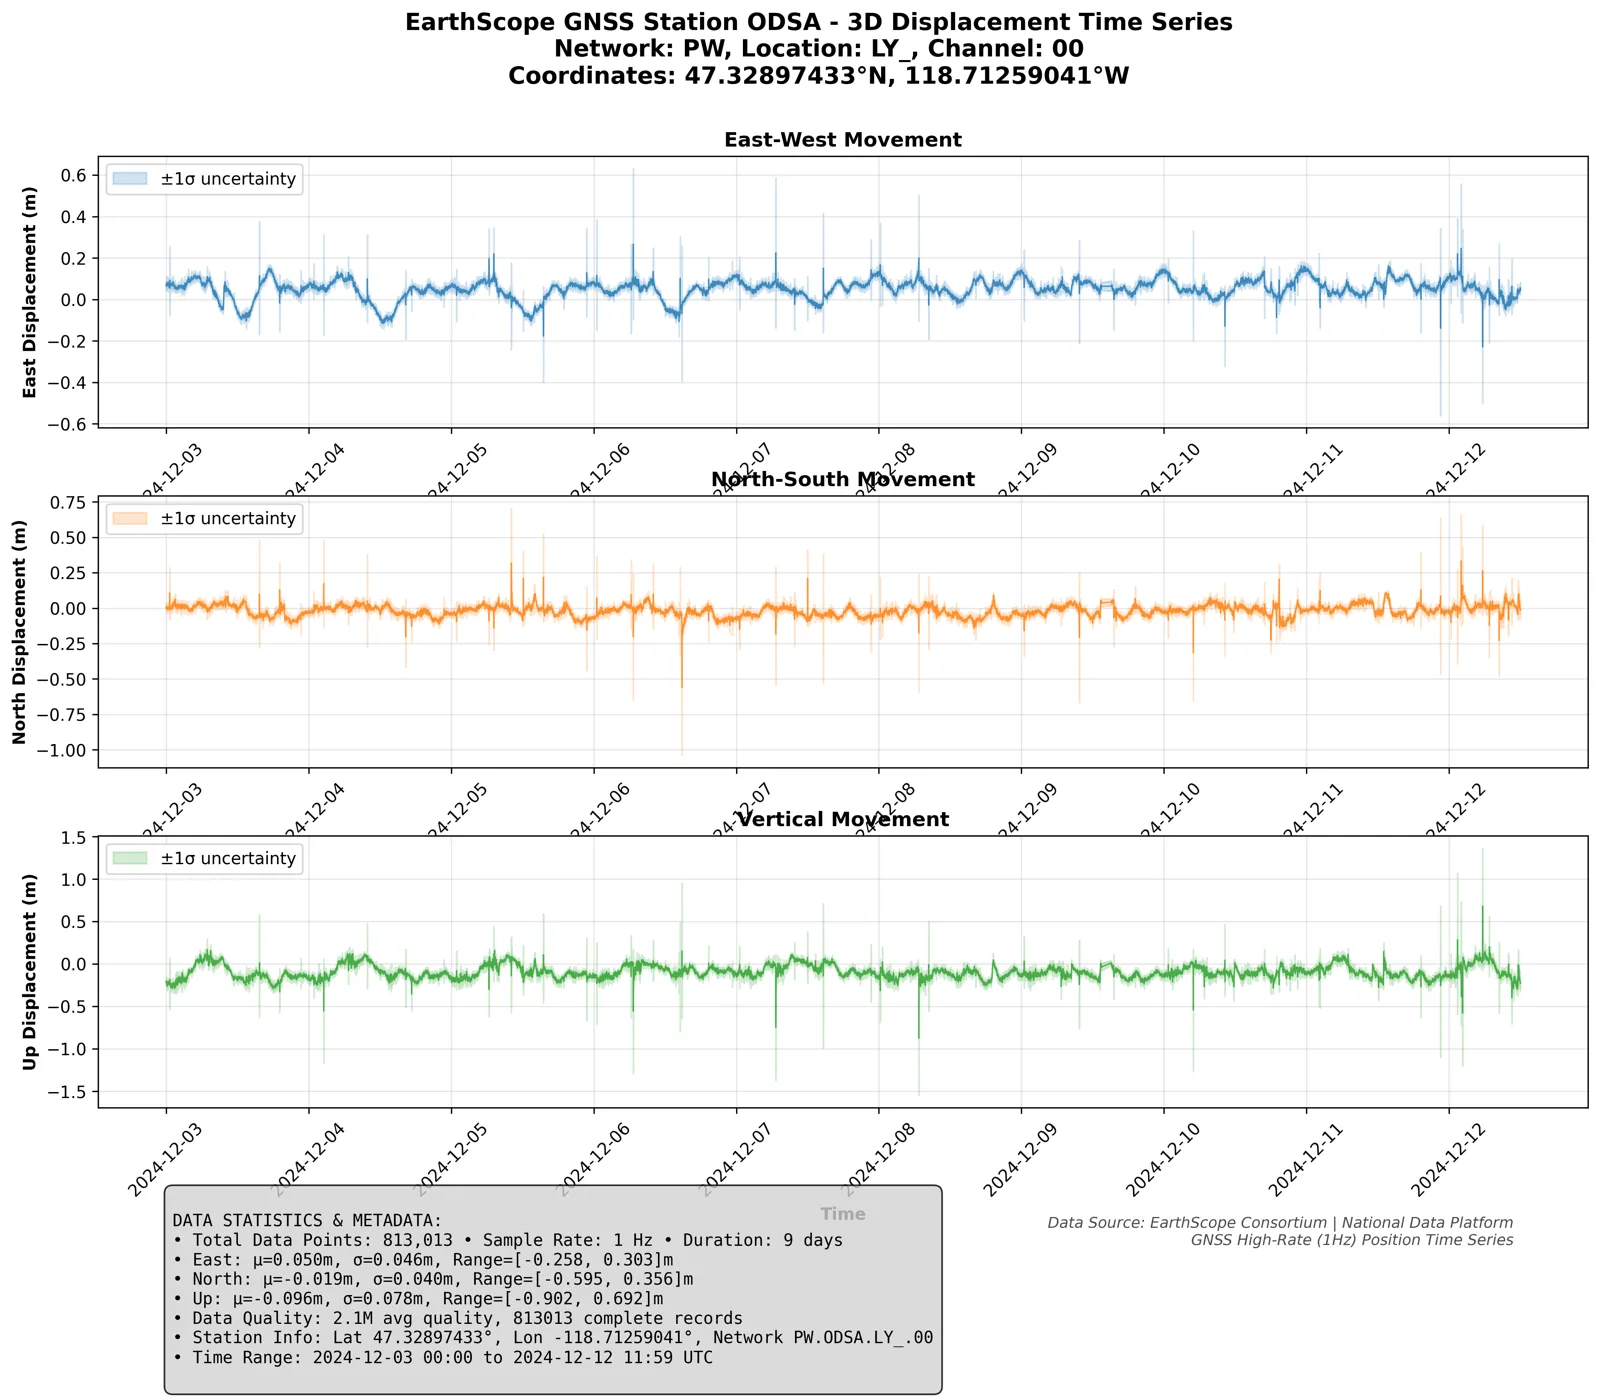
comprehensive_gnss_analysis.png East, north and vertical displacement with station metadata.comprehensive_seismic_plot.py The plotting script the agent wrote and ran with uv.
04 / ChronoLog MCP
Keep a record of agent sessions
and recall it later.
AgentLog writes the agent’s session events to ChronoLog. Earlier sessions ask about the machine and about NOAA datasets; a later session retrieves those answers from the log.
- Version
- Older CLIO Kit, then called IOWarp MCPs
- Recorded
- September 2025
- Agent
- Claude Code
- Data
- ChronoLog event log, National Data Platform
What was asked
- show my cpu information
- show network information
- List all organizations in the National Data Platform to see what data is available
- Find the climate datasets url from NOAA
- What was the NOAA URLs: NDFD we found in a previous conversation (use chronolog-mcp)
- What was the machine information we found in previous conversation (use chronolog-mcp)
MCP calls in the recording
chronolog-mcpndp-mcp list_organizationsndp-mcp search_datasetsndp-mcp get_dataset_details
What it demonstrates
Showcase of AgentLog (ChronoLog MCP) providing full analysis and observability of interactive session events, demonstrating natural language queries on distributed logging data with comprehensive event tracking.
Use the current ChronoLog server →What it produced
Recalled from ChronoLog in a new session
- NDFD HTTPS access: https://www.ncei.noaa.gov/data/national-digital-forecast-database/access/
- NDFD THREDDS server: https://www.ncei.noaa.gov/thredds/model/ndfd.html
- Intel Xeon Silver 4114 · 20 physical and 40 logical cores · 4.68% average CPU use