Analysis 3 min read
Summarize and plot experiment results
Connect Pandas and Plot, install a summary skill, and turn experiment runs into checked means and a chart.
- Written for
- CLIO Kit 2.11
- Works in
- Claude Code · Codex · Clio Coder · OpenCode
- Basis
- Recorded sessions · 7 Oct 2026
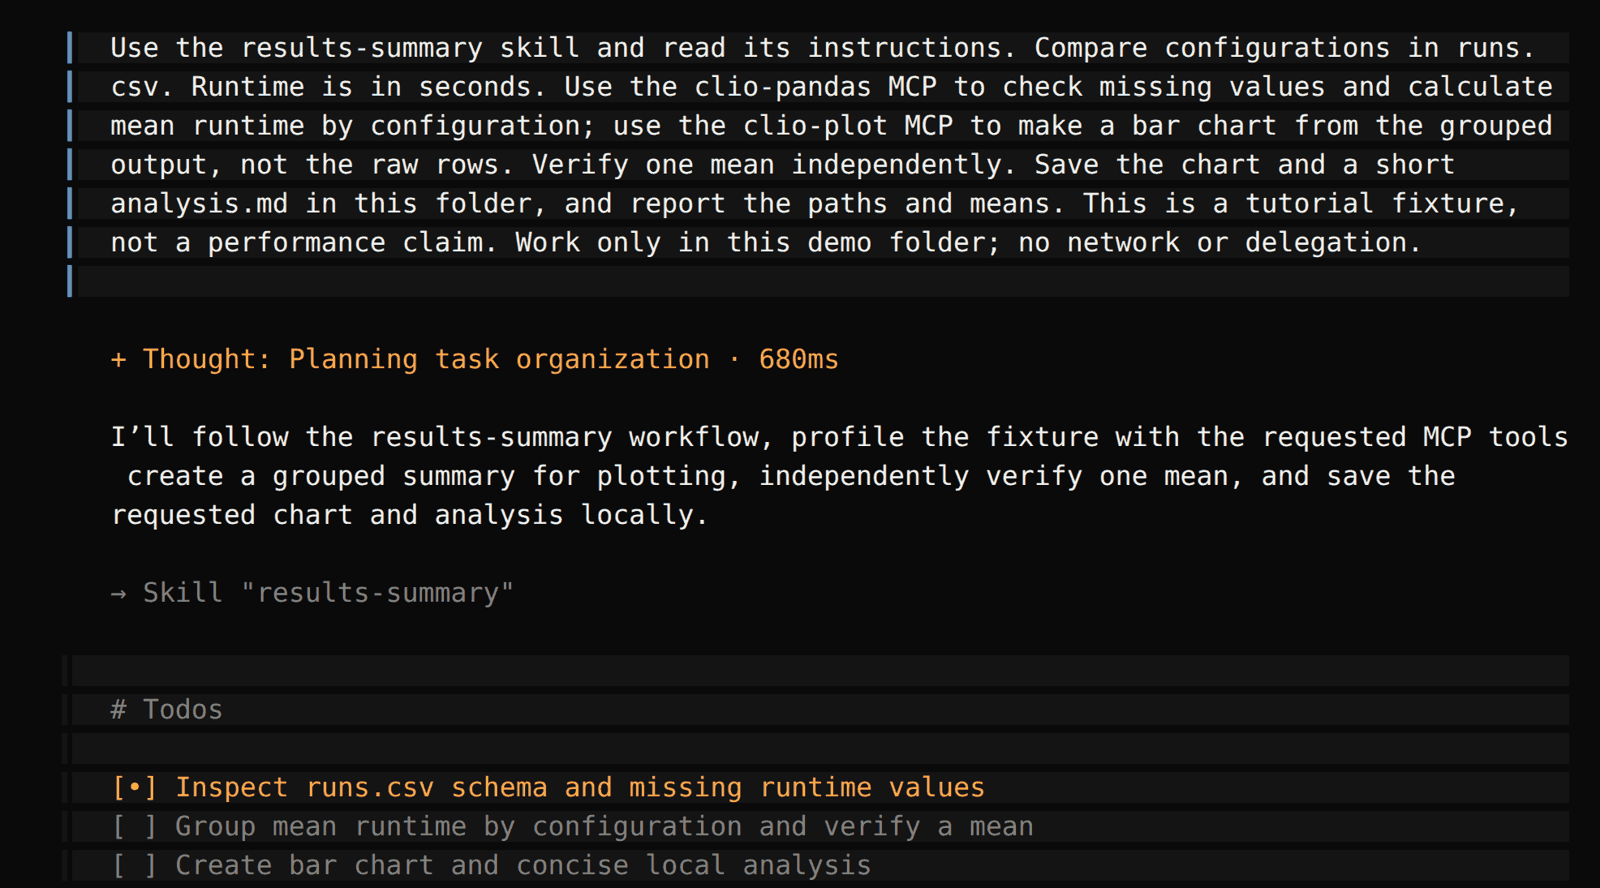
Give your agent a CSV of experiment runs and ask it to compare configurations. You connect the Pandas and Plot MCP servers, add the results-summary skill, and produce a grouped CSV, a bar chart and a short analysis. The screenshots are real sessions in Claude Code, Codex, Clio Coder and OpenCode, recorded with the versions listed in Explore an HDF5 file. The eight rows are a tutorial fixture, not evidence of a real system's performance.
1. Add the experiment results
Start with the CLIO Kit launcher
installed. In a new project, download runs.csv or save this as
runs.csv:
configuration,trial,runtime_s
baseline,1,12
baseline,2,13
baseline,3,11
baseline,4,14
tuned,1,9
tuned,2,10
tuned,3,8
tuned,4,11
Each row is one trial, and runtime_s is elapsed time in seconds.
2. Connect the tools, install the skill and ask
The skill explains how to pass transformed data between the two servers. It does not configure either MCP by itself.
- Claude Code
- Codex
- Clio Coder
- OpenCode
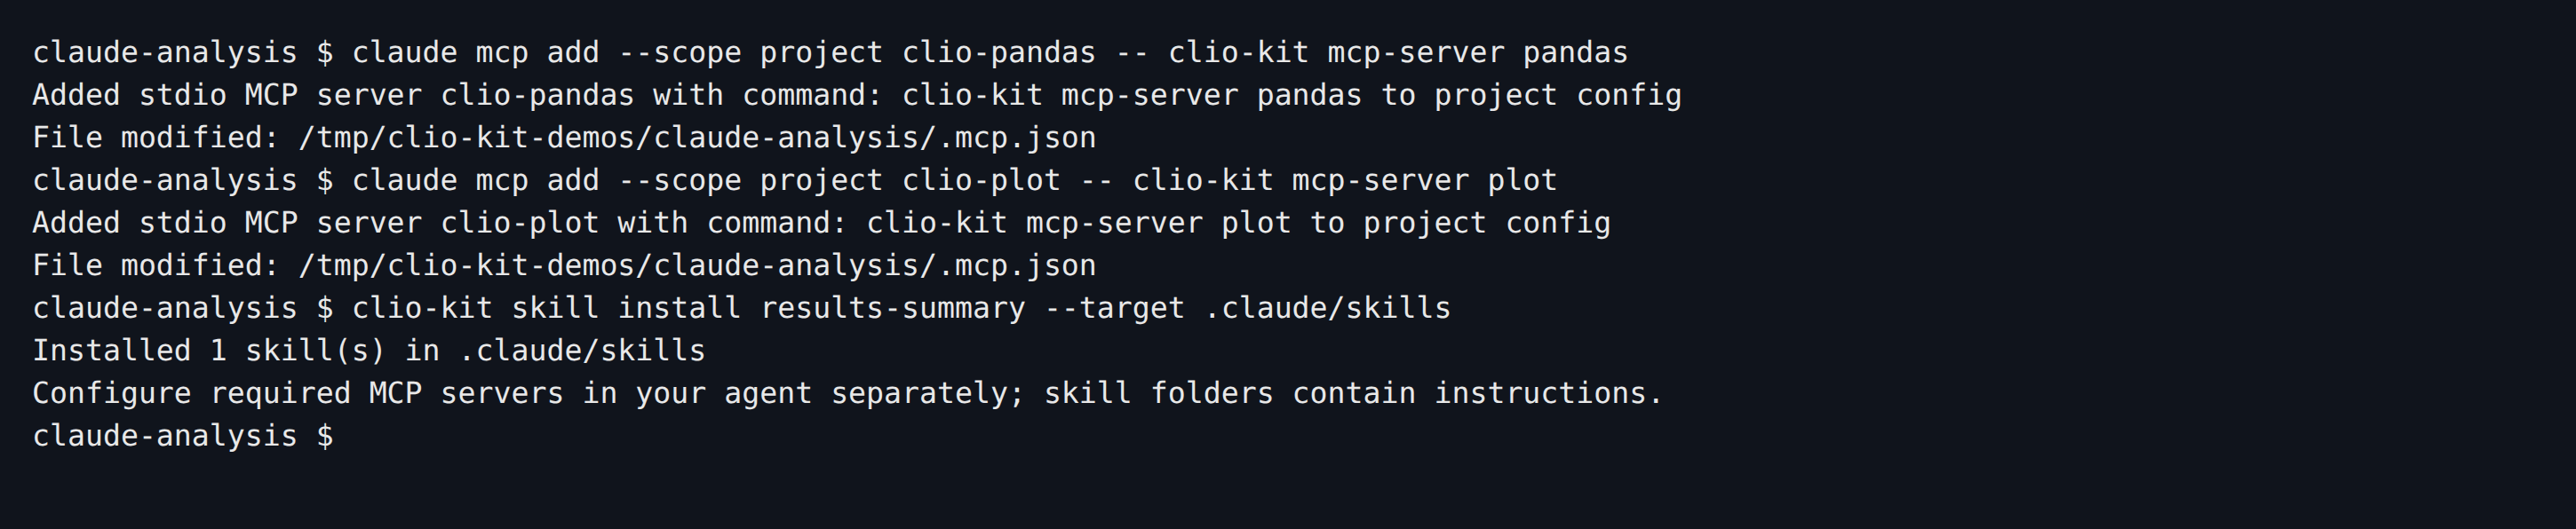
claude mcp add --scope project clio-pandas -- clio-kit mcp-server pandas
claude mcp add --scope project clio-plot -- clio-kit mcp-server plot
clio-kit skill install results-summary --target .claude/skills
claude
The two MCP entries go in .mcp.json; the skill goes in
.claude/skills/results-summary/.
Enable the two project MCP servers, check /mcp, then ask:
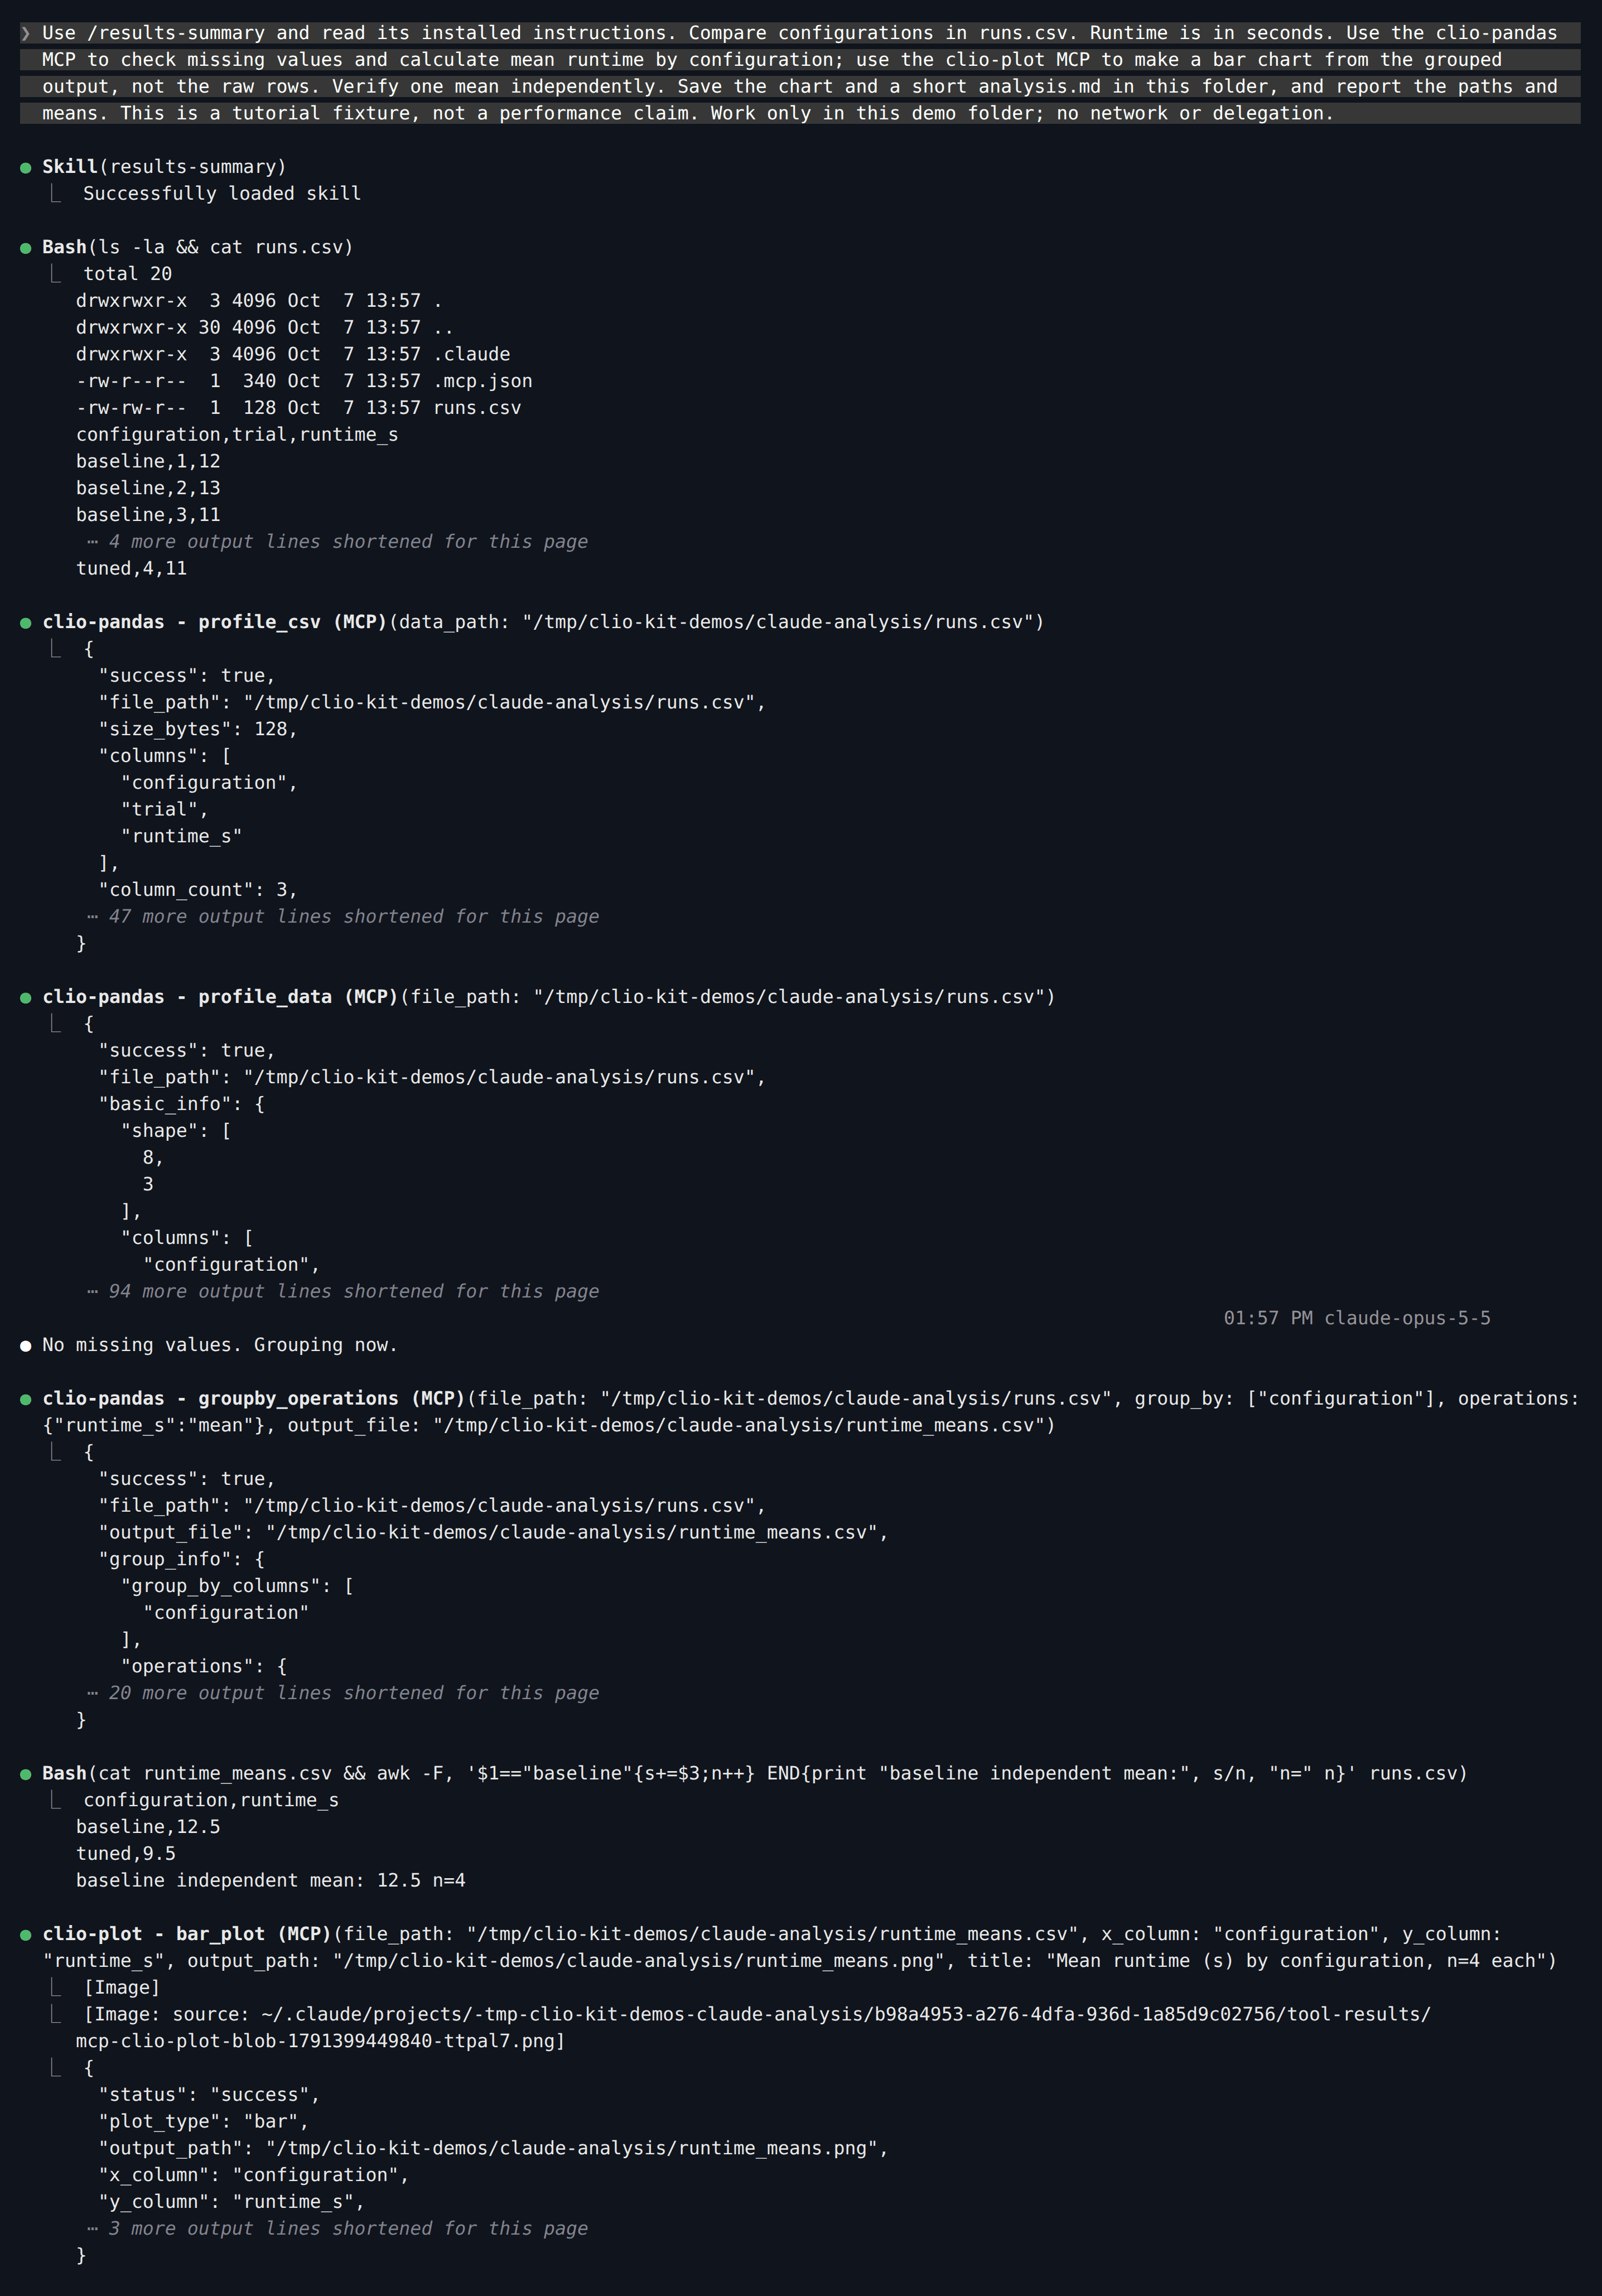
Use /results-summary and read its installed instructions. Compare configurations in runs.csv. Runtime is in seconds. Use the clio-pandas MCP to check missing values and calculate mean runtime by configuration; use the clio-plot MCP to make a bar chart from the grouped output, not the raw rows. Verify one mean independently. Save the chart and a short analysis.md in this folder, and report the paths and means. This is a tutorial fixture, not a performance claim. Work only in this demo folder; no network or delegation.
Ctrl+O shows each tool call. Pandas profiled the table and wrote the grouped
means to runtime_means.csv; Claude passed that file to Plot's bar_plot:
Save this as .codex/config.toml in the project:
[mcp_servers.clio-pandas]
command = "clio-kit"
args = ["mcp-server", "pandas"]
startup_timeout_sec = 120

[mcp_servers.clio-plot]
command = "clio-kit"
args = ["mcp-server", "plot"]
startup_timeout_sec = 120
clio-kit skill install results-summary --target .agents/skills
codex
Trust the folder, check /mcp, then ask:
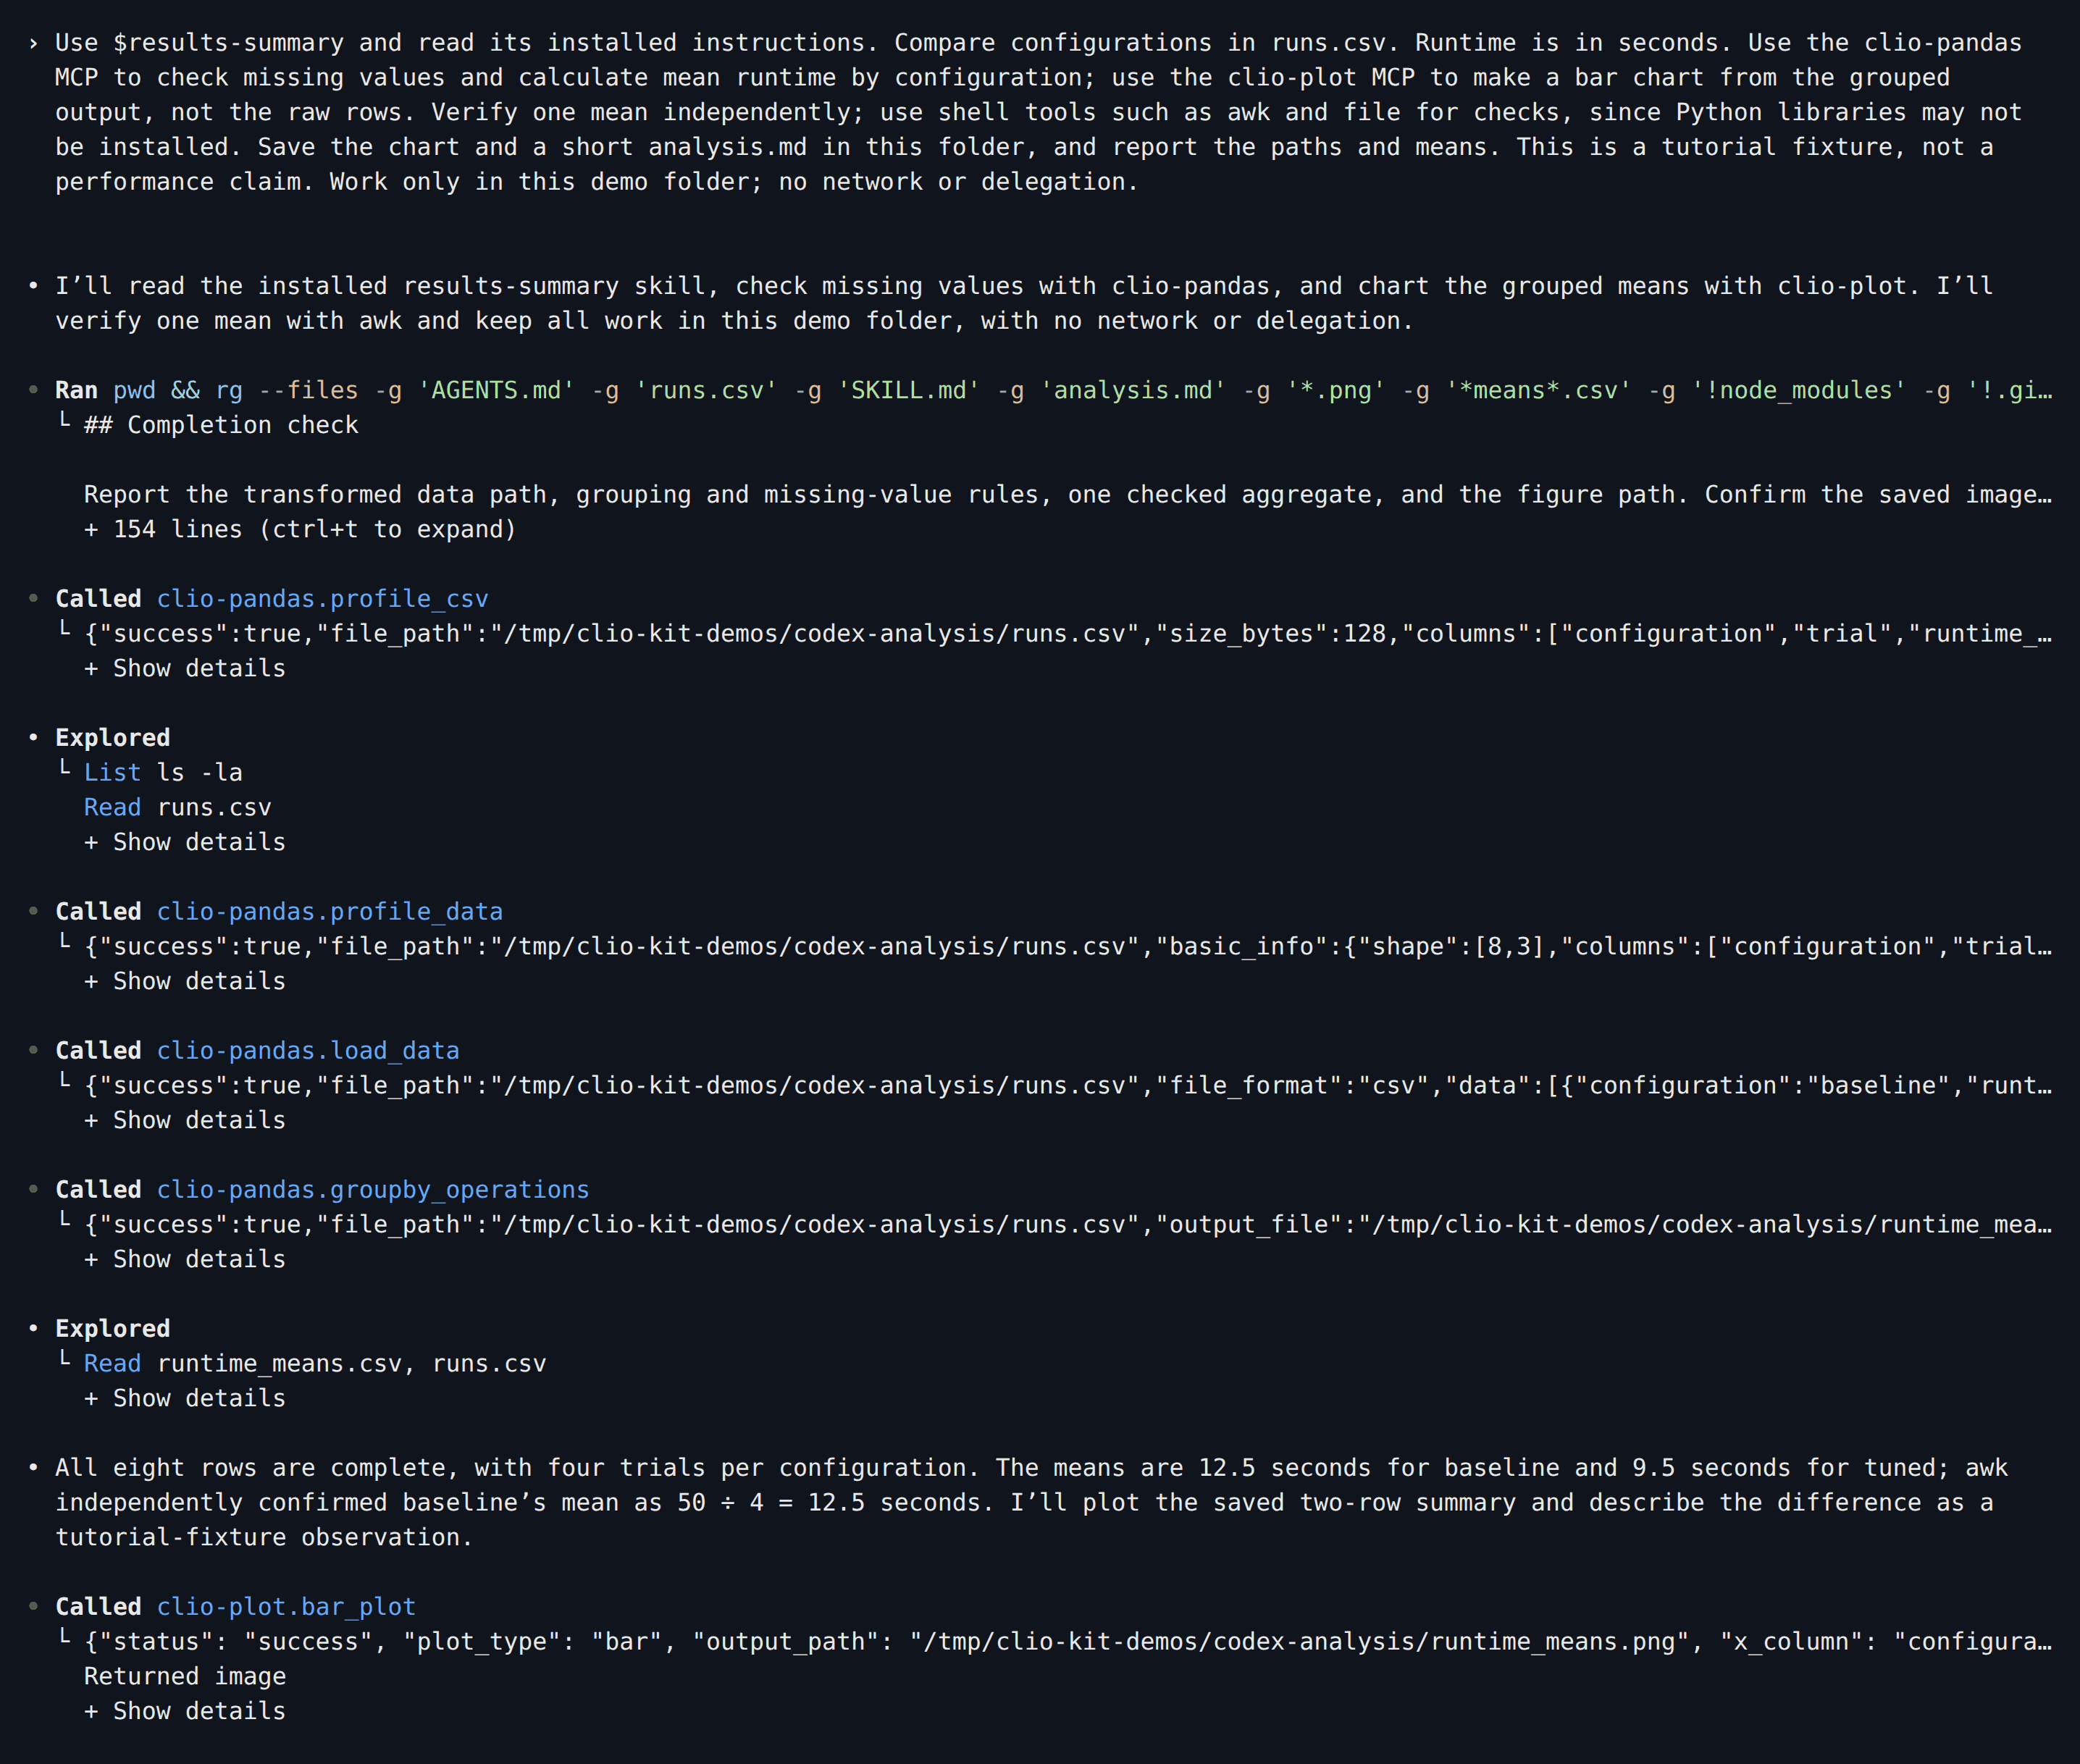
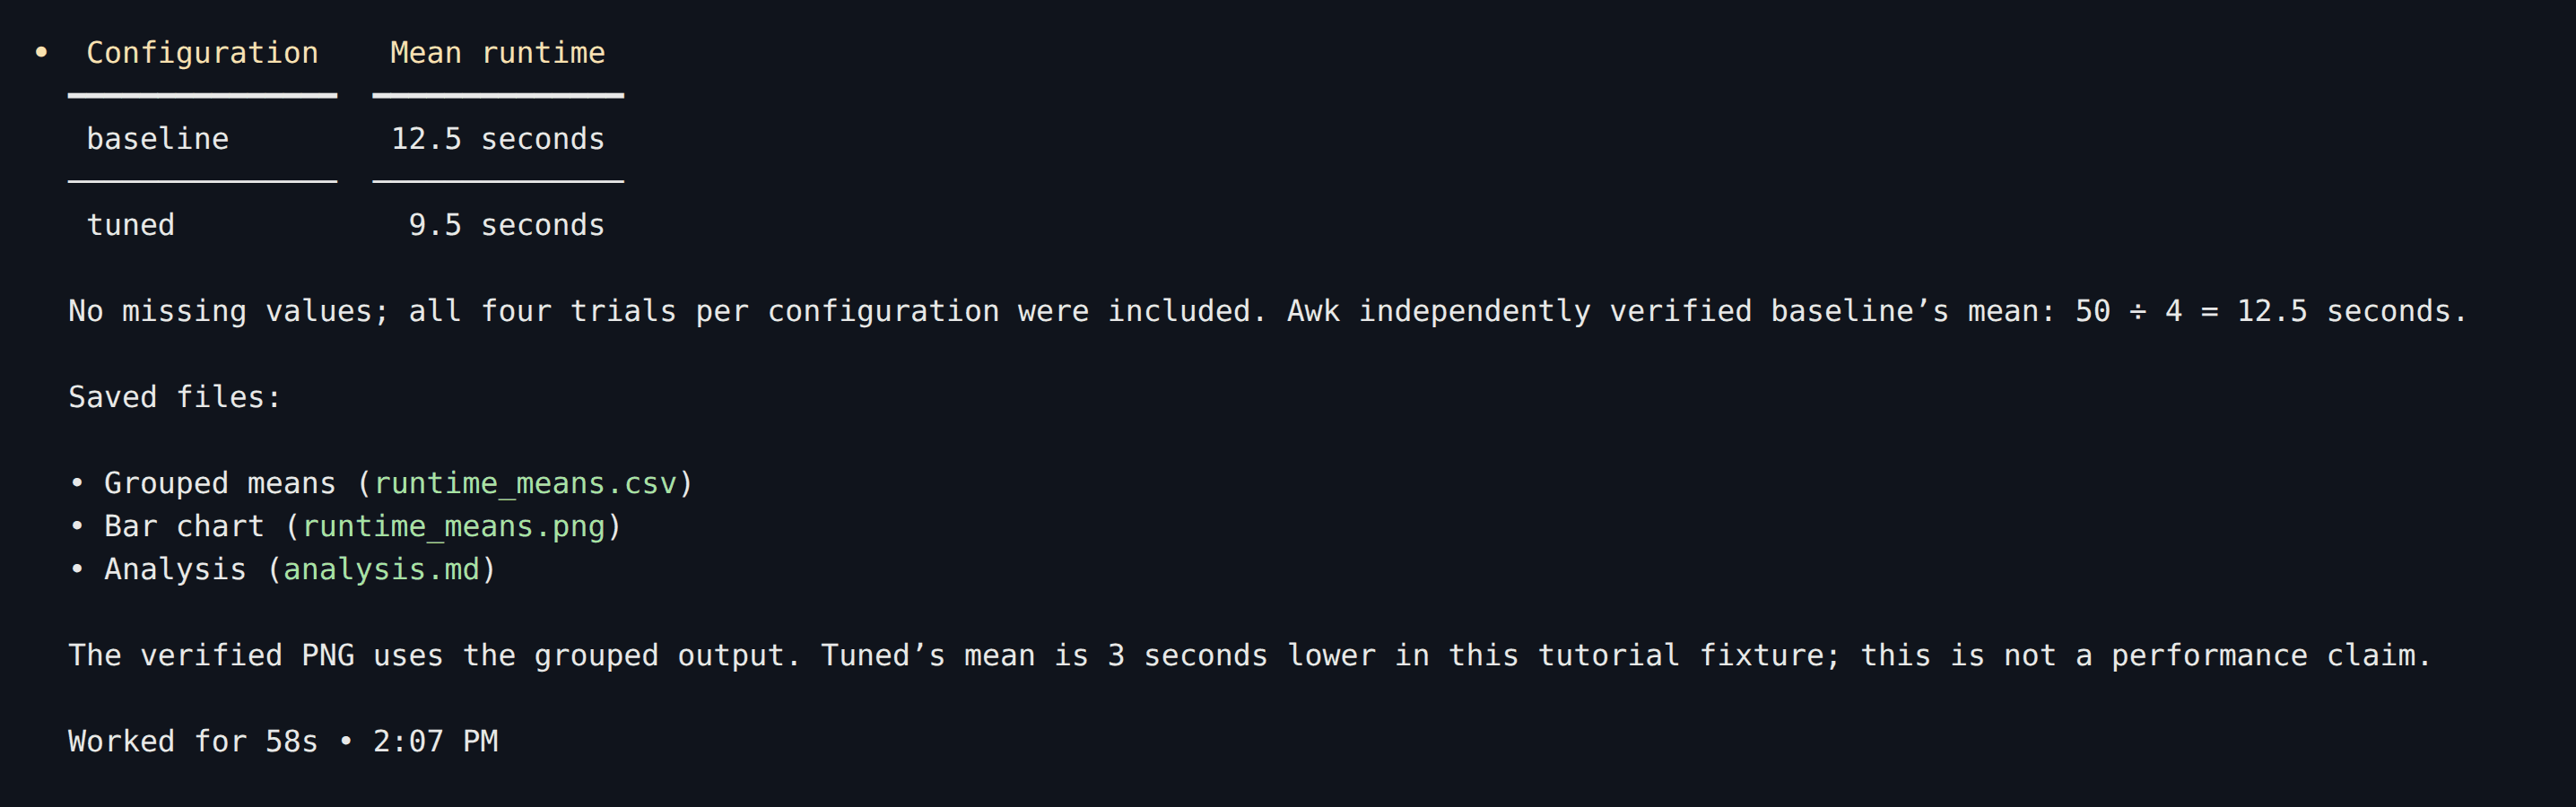
Use $results-summary and read its installed instructions. Compare configurations in runs.csv. Runtime is in seconds. Use the clio-pandas MCP to check missing values and calculate mean runtime by configuration; use the clio-plot MCP to make a bar chart from the grouped output, not the raw rows. Verify one mean independently; use shell tools such as awk and file for checks, since Python libraries may not be installed. Save the chart and a short analysis.md in this folder, and report the paths and means. This is a tutorial fixture, not a performance claim. Work only in this demo folder; no network or delegation.
The shell-tools sentence matters: without it, Codex tried to check the chart with a Python imaging library that was not installed.
Save this as .clio-coder/mcp.yaml:
version: 1
servers:
  - id: clio-pandas
    command: clio-kit
    args: [mcp-server, pandas]
    timeoutMs: 120000
  - id: clio-plot
    command: clio-kit
    args: [mcp-server, plot]
    timeoutMs: 120000
clio-coder mcp trust clio-pandas
clio-coder mcp trust clio-plot
clio-kit skill install results-summary --target .clio-coder/skills
clio-coder
Ask:
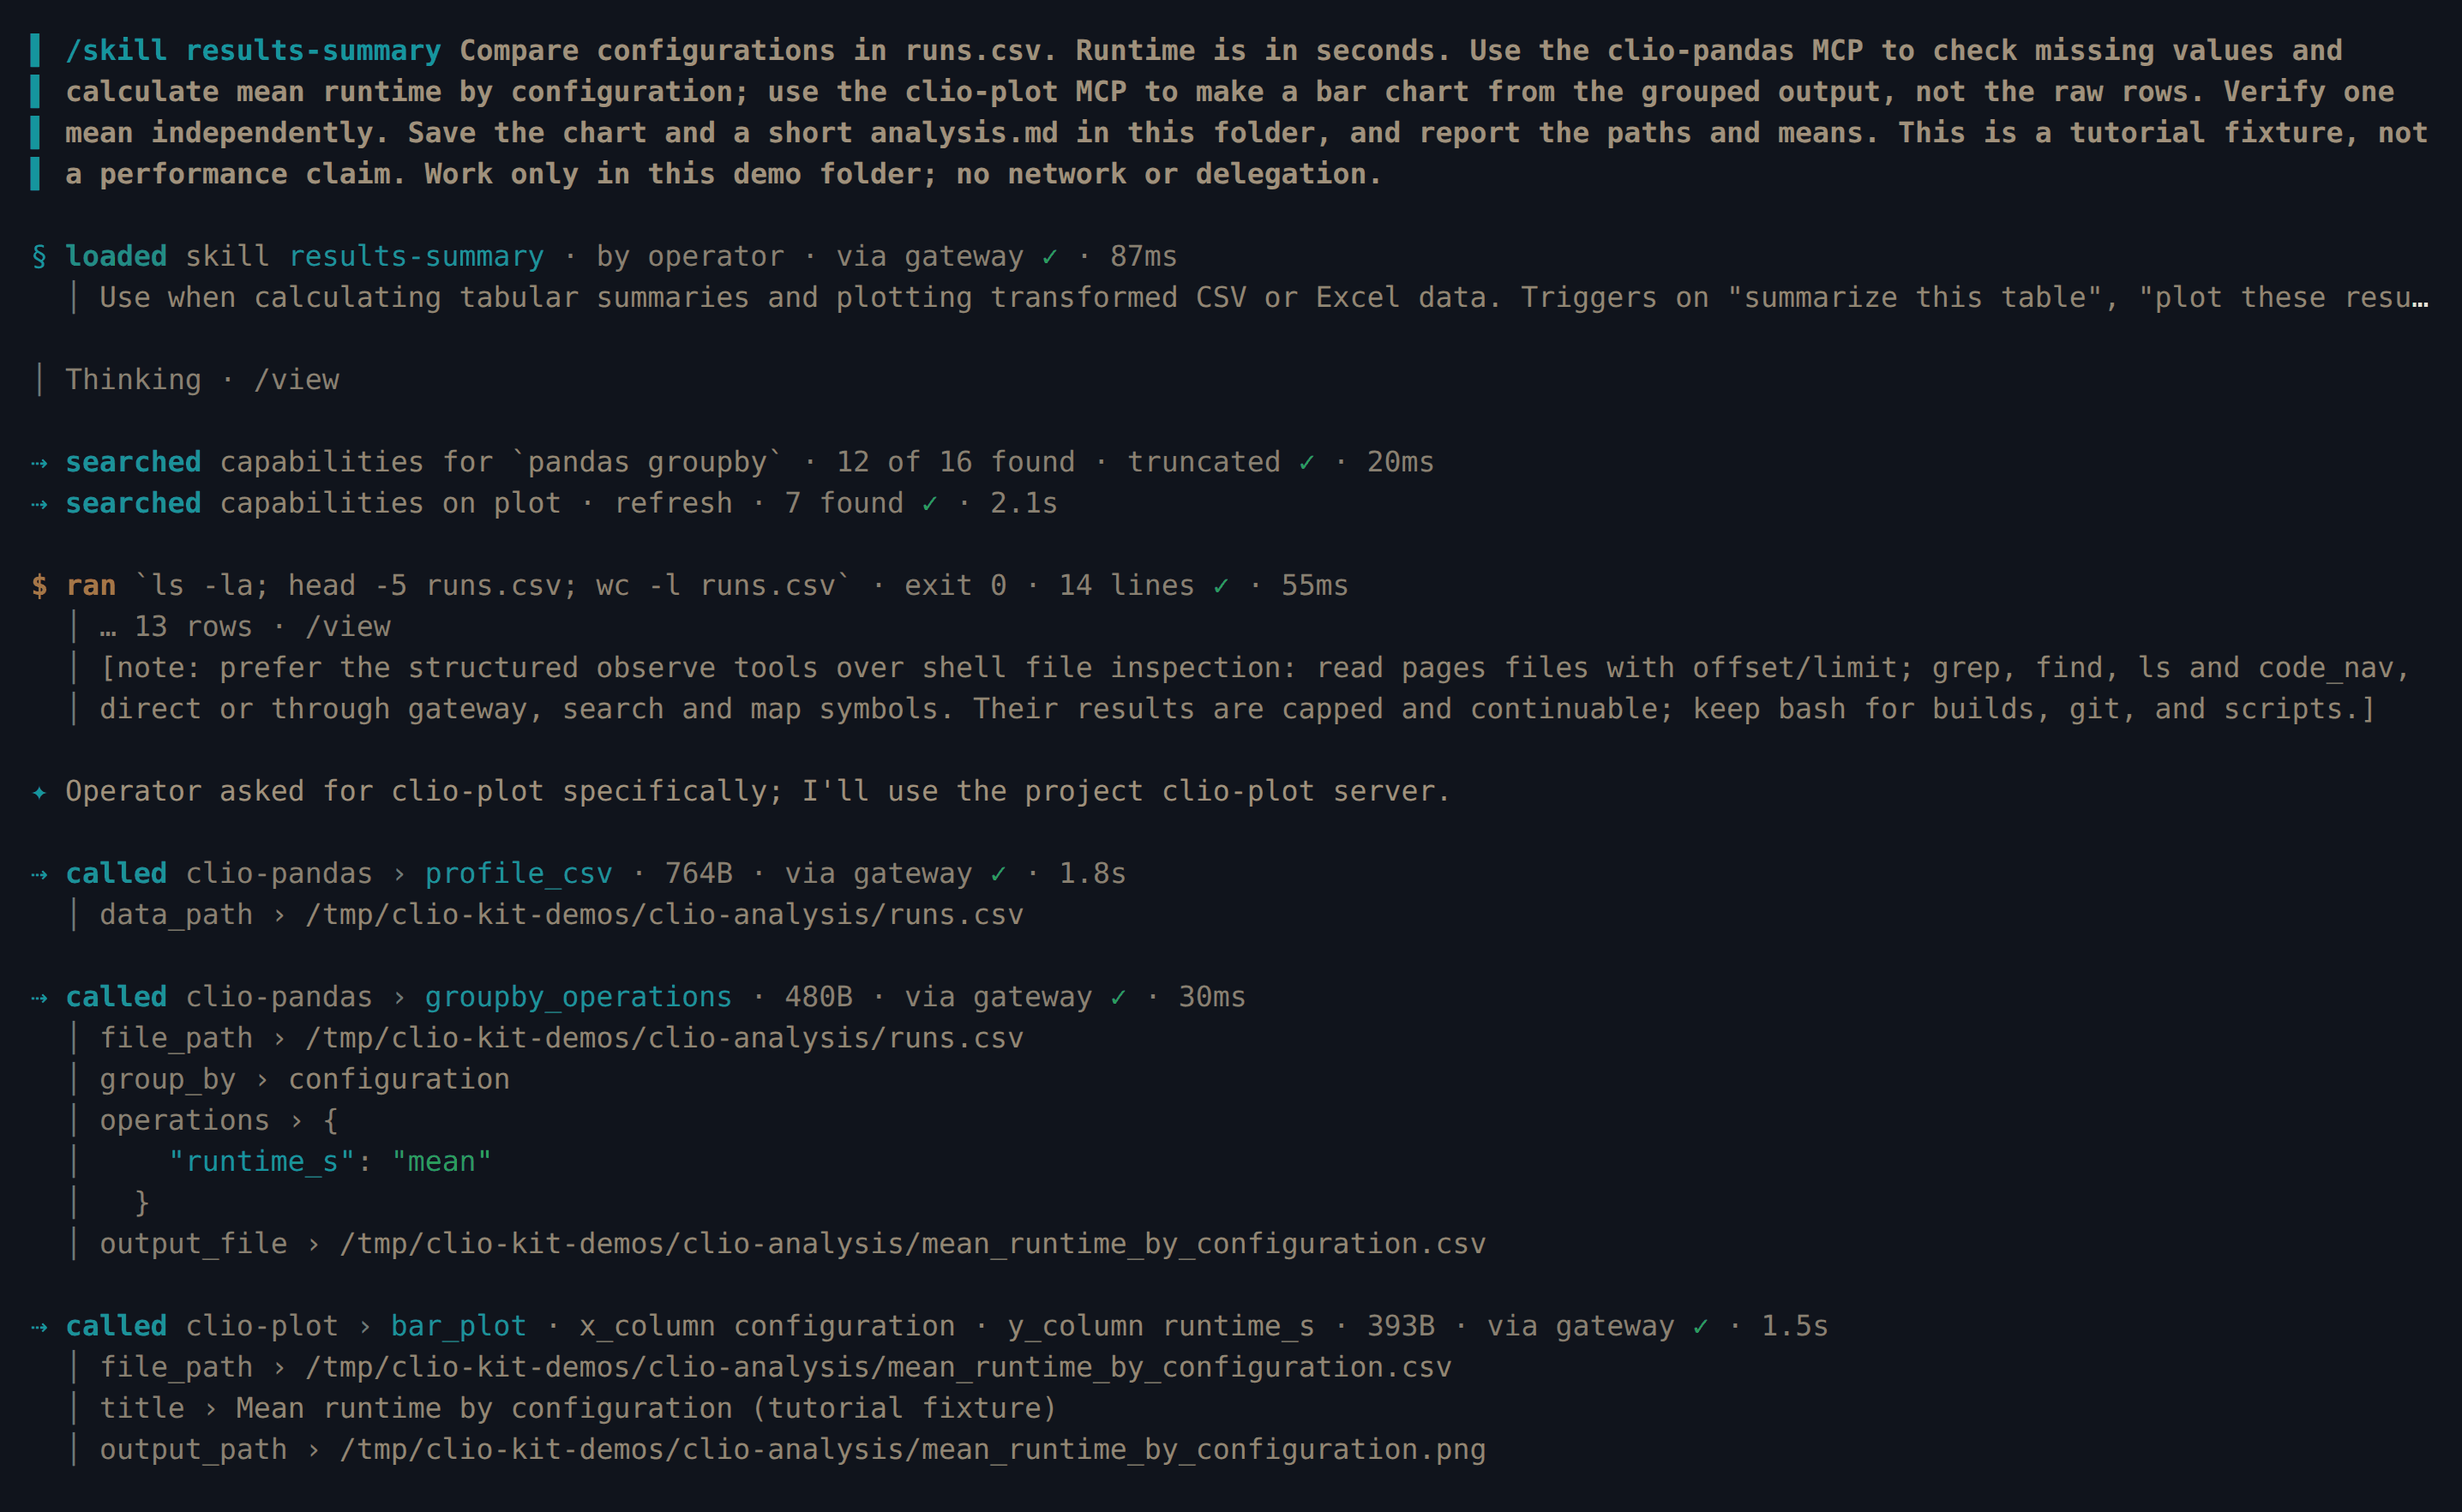
/skill results-summary Compare configurations in runs.csv. Runtime is in seconds. Use the clio-pandas MCP to check missing values and calculate mean runtime by configuration; use the clio-plot MCP to make a bar chart from the grouped output, not the raw rows. Verify one mean independently. Save the chart and a short analysis.md in this folder, and report the paths and means. This is a tutorial fixture, not a performance claim. Work only in this demo folder; no network or delegation.
Save this as opencode.json in the project:
{
  "$schema": "https://opencode.ai/config.json",
  "mcp": {
    "clio-pandas": {
      "type": "local",
      "command": ["clio-kit", "mcp-server", "pandas"],
      "enabled": true,
      "timeout": 120000
    },
    "clio-plot": {
      "type": "local",
      "command": ["clio-kit", "mcp-server", "plot"],
      "enabled": true,
      "timeout": 120000
    }
  }
}
clio-kit skill install results-summary --target .agents/skills
opencode
Ask:
Use the results-summary skill and read its instructions. Compare configurations in runs.csv. Runtime is in seconds. Use the clio-pandas MCP to check missing values and calculate mean runtime by configuration; use the clio-plot MCP to make a bar chart from the grouped output, not the raw rows. Verify one mean independently. Save the chart and a short analysis.md in this folder, and report the paths and means. This is a tutorial fixture, not a performance claim. Work only in this demo folder; no network or delegation.
3. Watch the handoff between tools
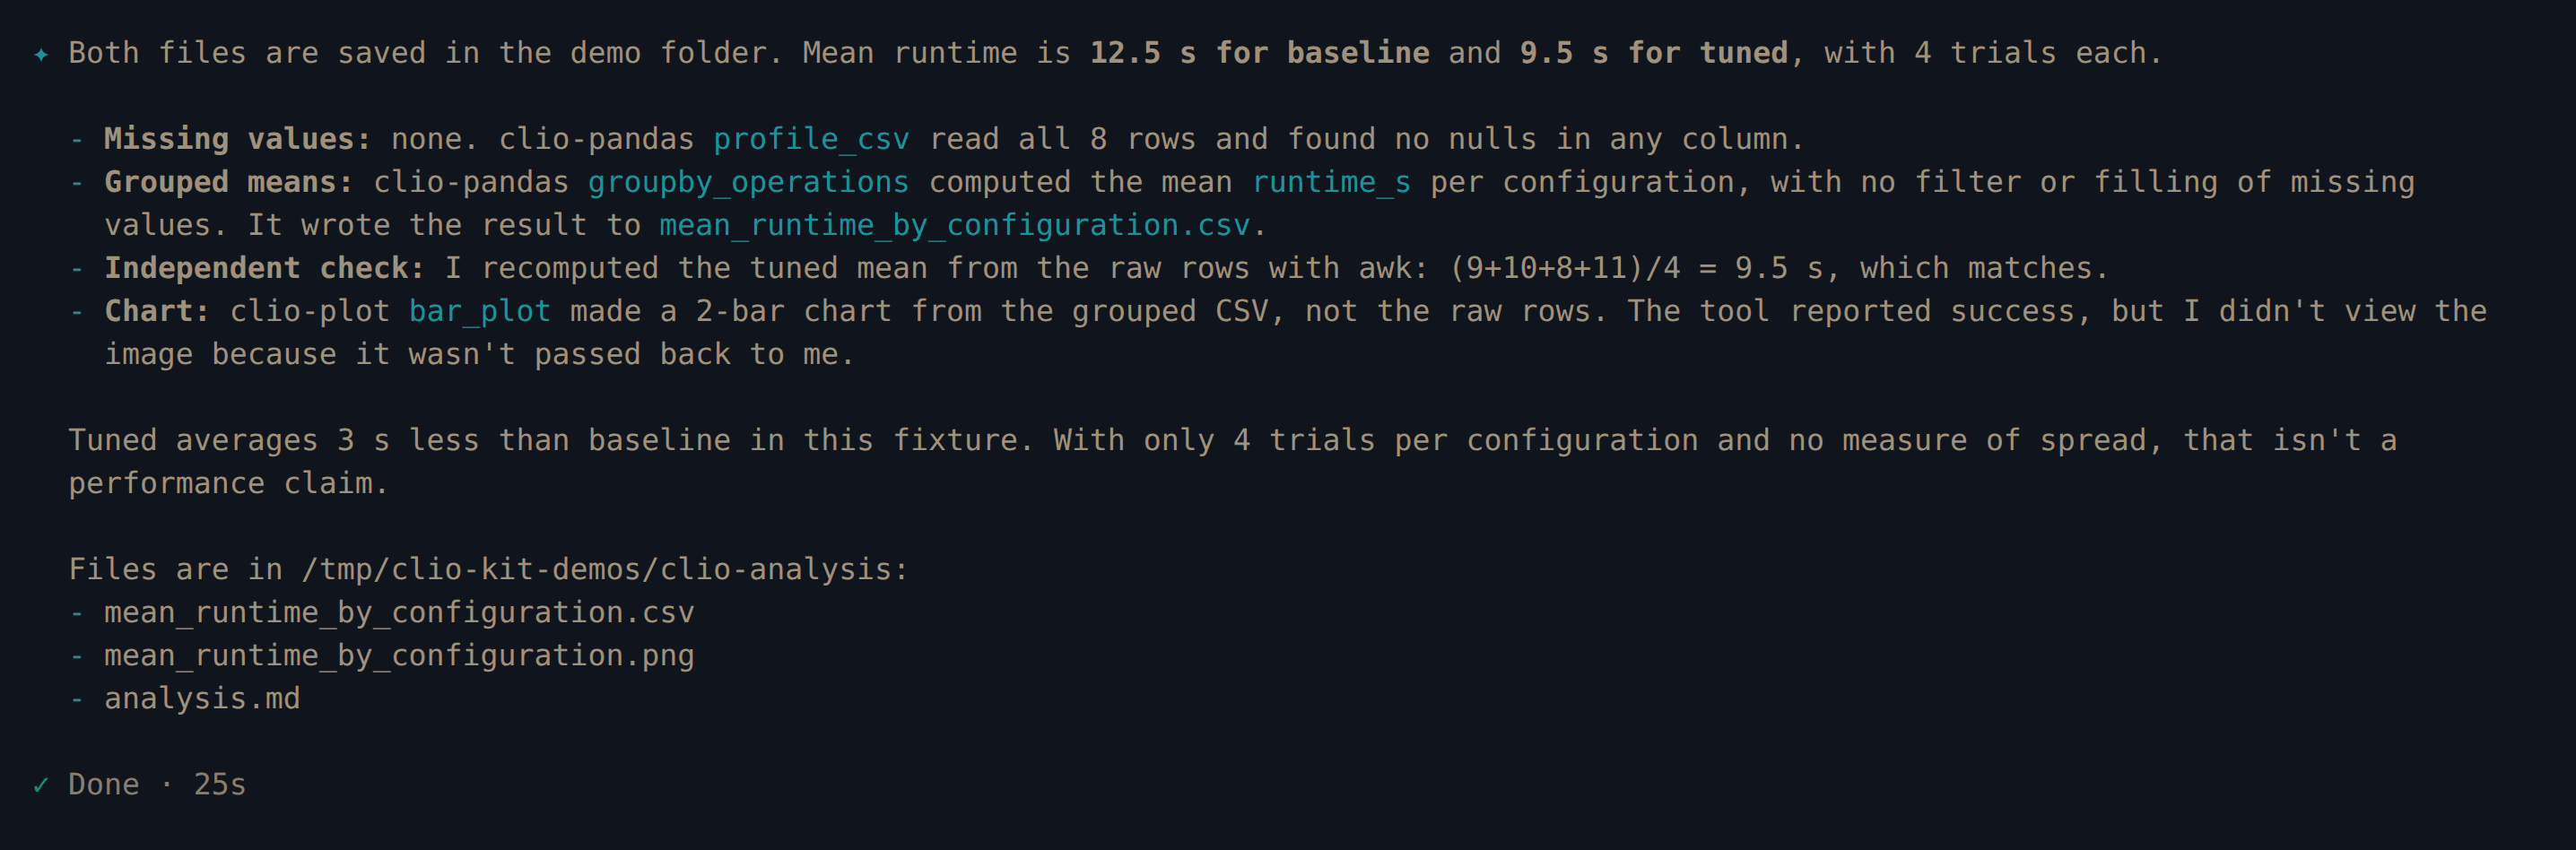
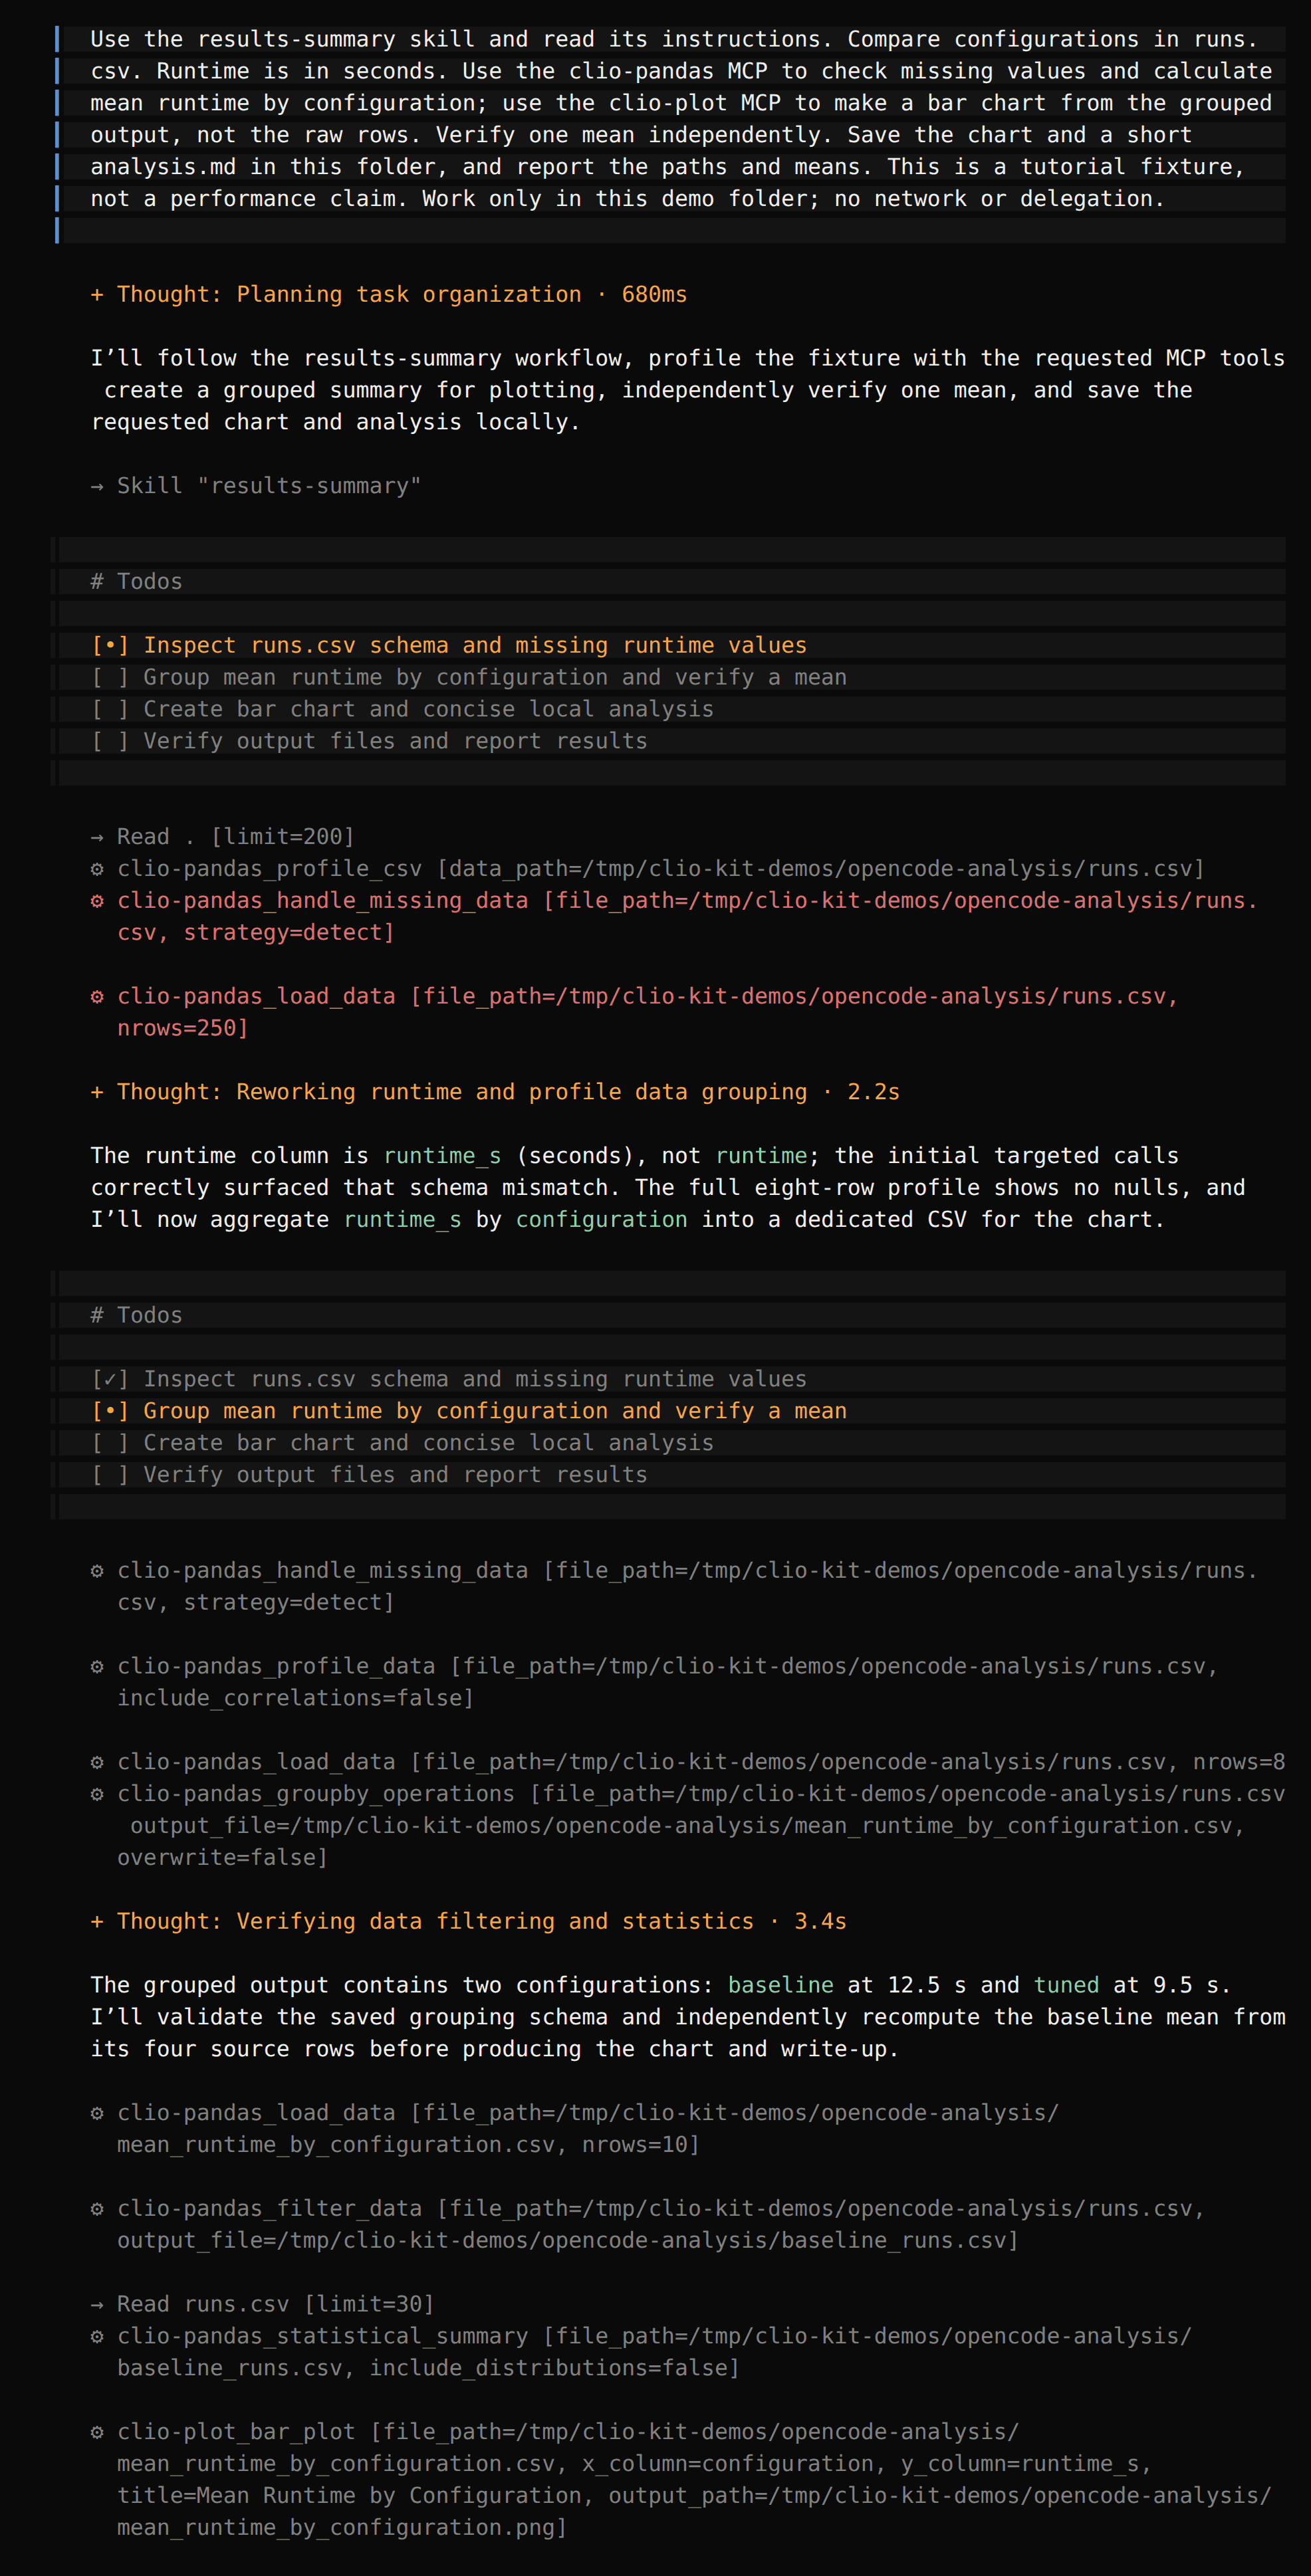
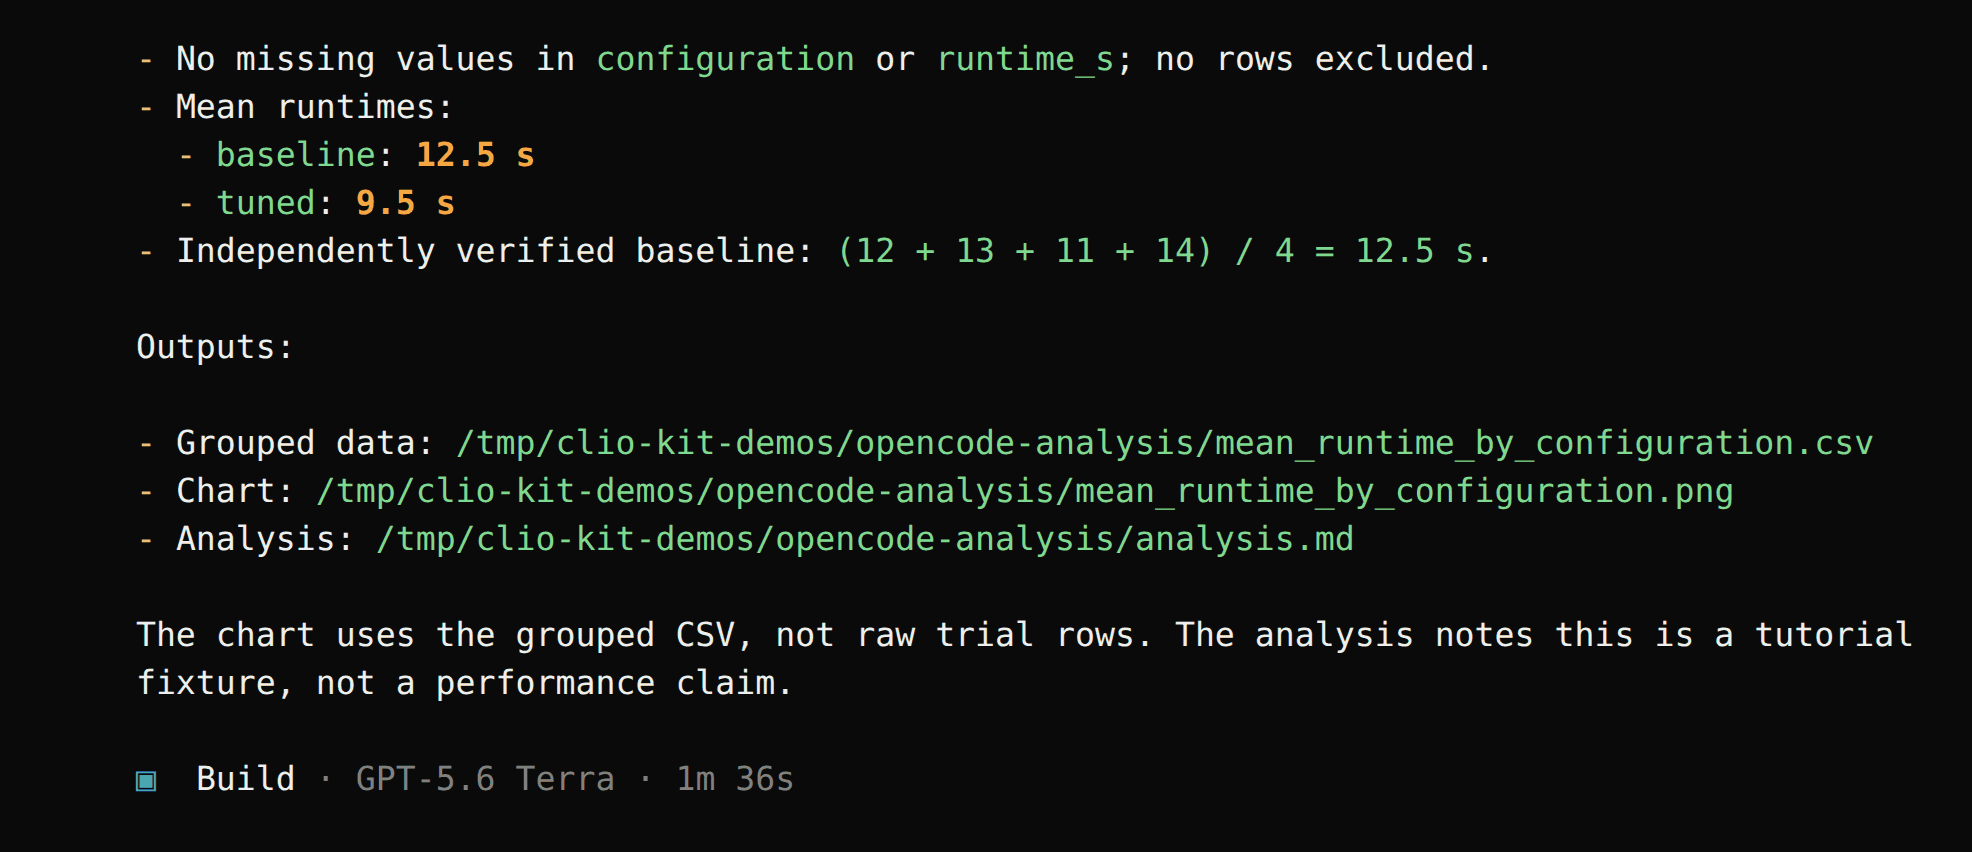
In every session Pandas grouped the rows and saved the means to a new CSV, and the
agent passed that file to bar_plot. This is why the skill matters: the
plotting server reads a file, not an in-memory Pandas result. Plotting the
original CSV would skip the aggregation you asked for. File names differ between
clients (runtime_means.csv or mean_runtime_by_configuration.csv); open the
path your agent reports.
4. Open the outputs and verify the numbers
cat analysis.md
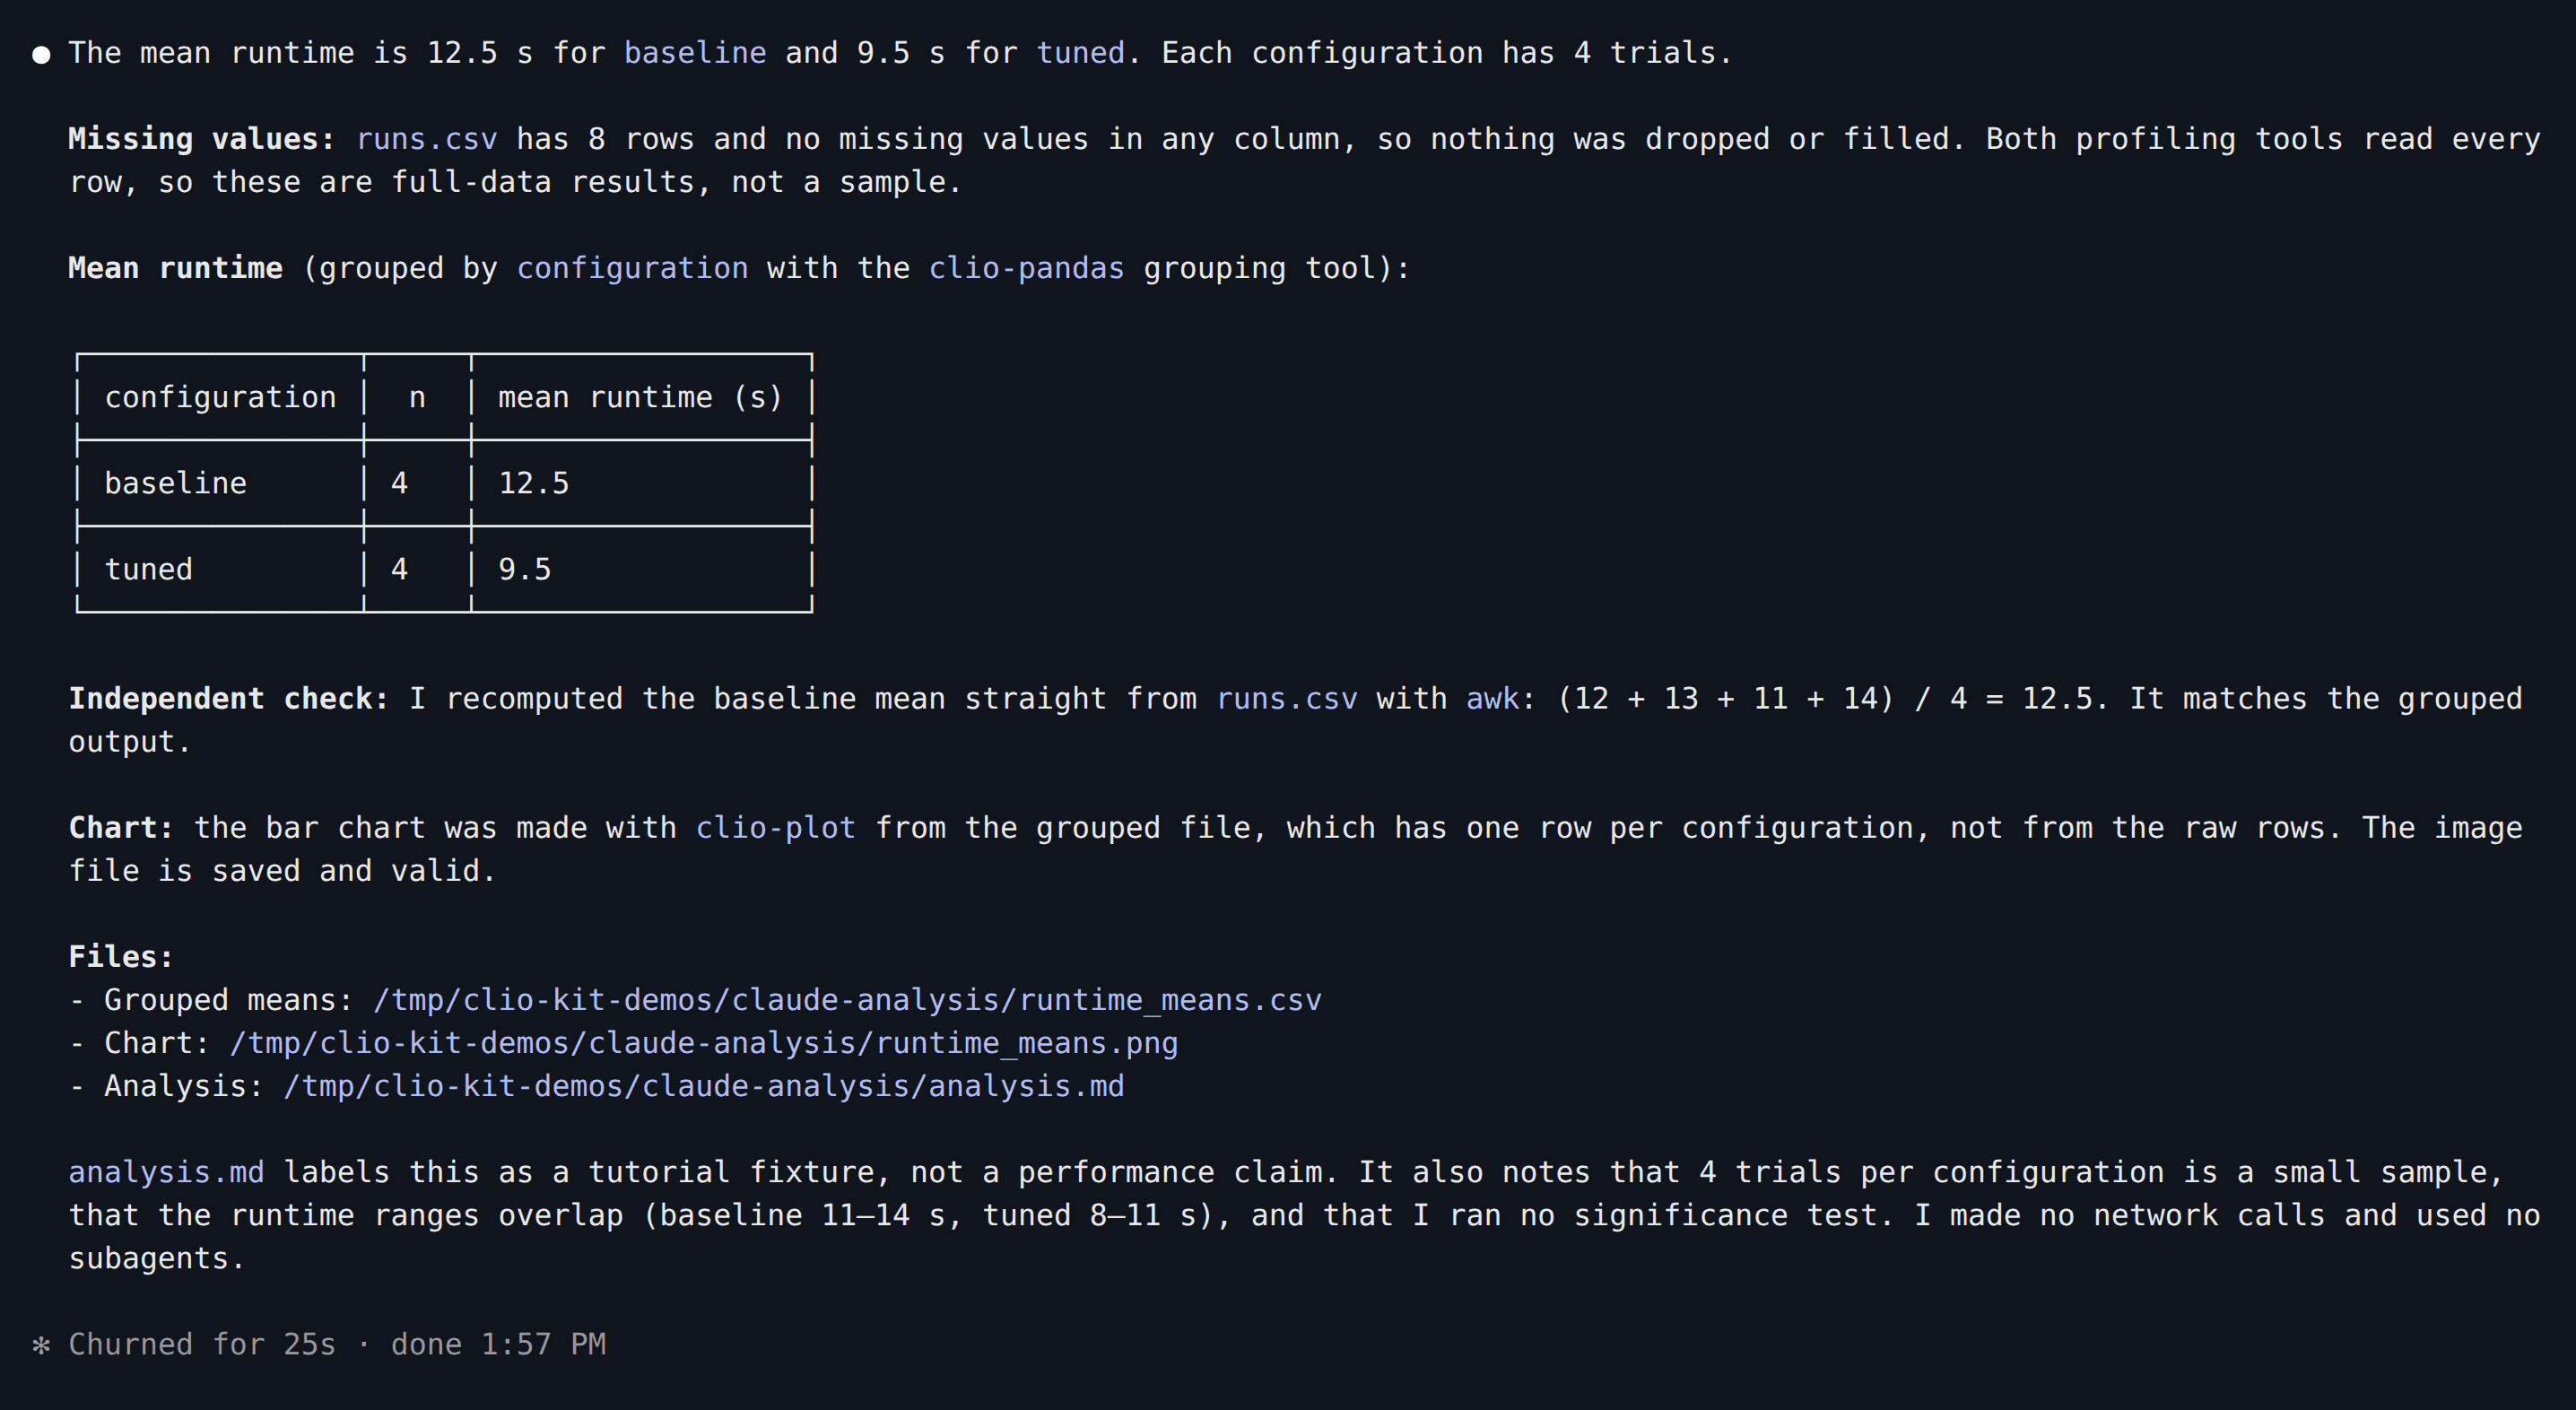
The grouped file should contain:
configuration,runtime_s
baseline,12.5
tuned,9.5
Check the means yourself: (12 + 13 + 11 + 14) / 4 = 12.5 seconds;
(9 + 10 + 8 + 11) / 4 = 9.5 seconds. After the four recorded sessions we
recomputed both means from the source CSV, compared them with each saved grouped
file, and confirmed runs.csv was unchanged.
Here is the chart the Plot MCP produced in the Claude Code session:
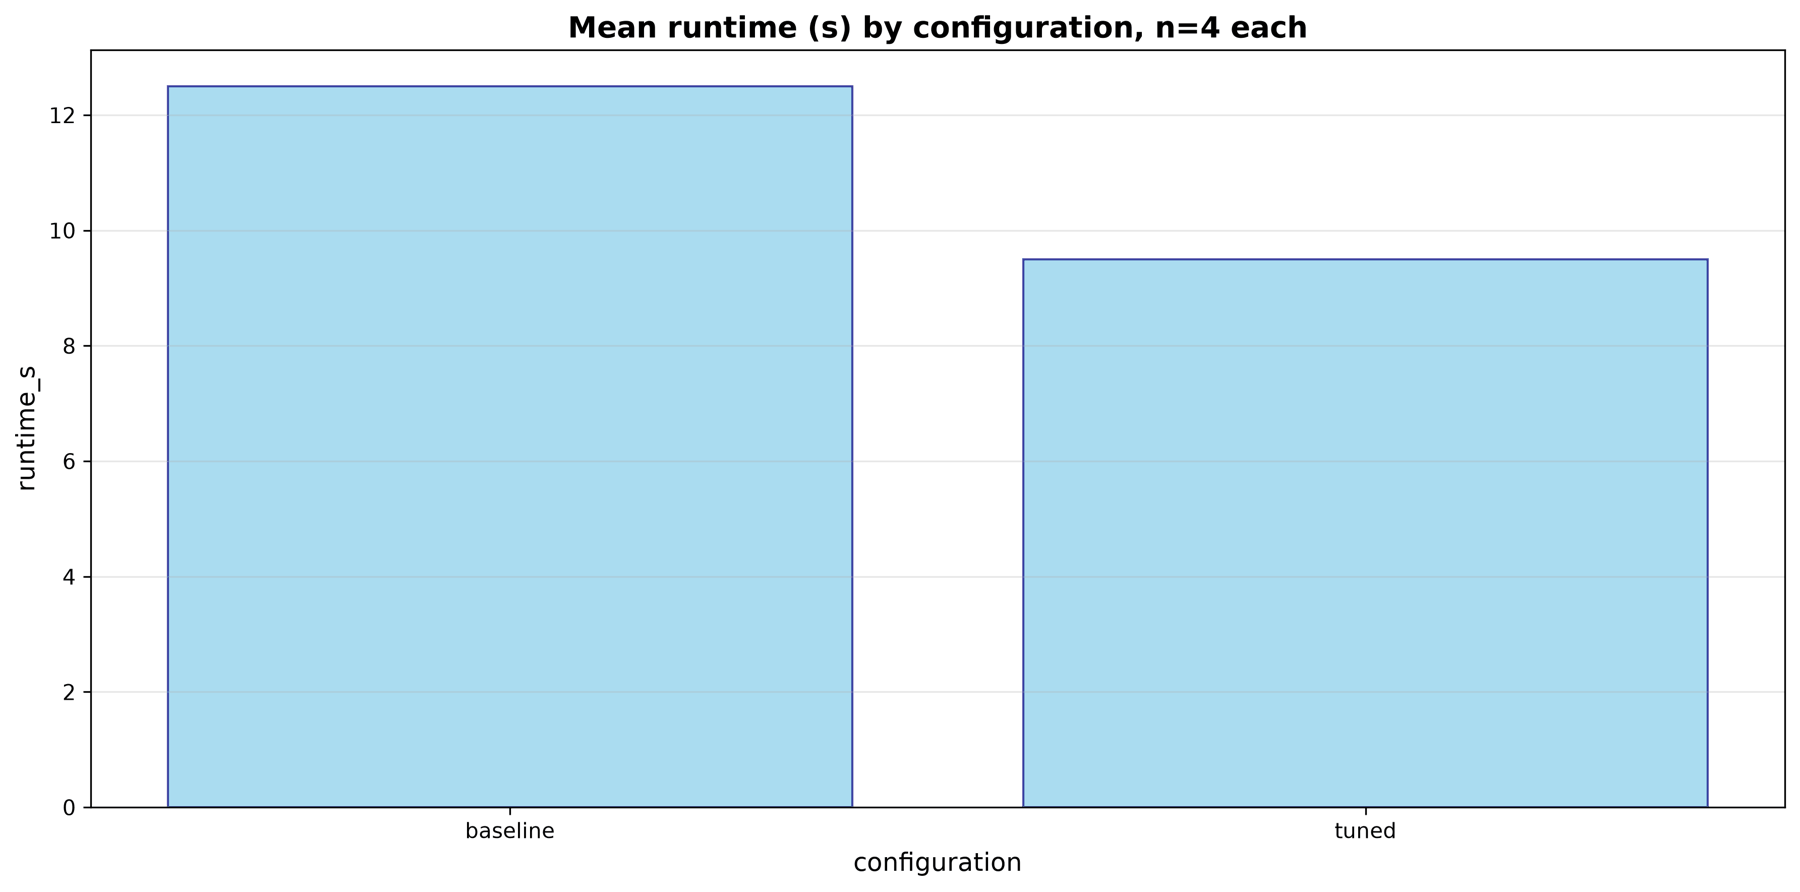
Check the units, categories and heights, not only whether the image exists.
If a tool is missing, run clio-kit doctor --server pandas --server plot --connect
and check your client's MCP list. If the skill is missing, check its installed
directory and start a fresh session. Model wording and file names can differ;
tool inputs and numeric results are the checks that matter.
Next: explore an HDF5 file, or build your own plugin.